FIGURE SUMMARY
Title

Genetically encoded cell-death indicators (GEDI) to detect an early irreversible commitment to neurodegeneration

Authors
Linsley, J.W., Shah, K., Castello, N., Chan, M., Haddad, D., Doric, Z., Wang, S., Leks, W., Mancini, J., Oza, V., Javaherian, A., Nakamura, K., Kokel, D., Finkbeiner, S.
Source
Full text @ Nat. Commun.

GEDI detects the death of neurons.

A Relative fluorescence of GECI’s GCaMP6f79 and RCEPIA36/RGEDI across Ca2+ concentrations present in the cytosol, endoplasmic reticulum, and extracellular milieu modeled from previously reported Hill coefficients and Kd values. B Representative fluorescence images of rat primary cortical neurons transfected with GCaMP6f or RGEDI at baseline, during 30 Hz × 3 s field stimulation, or after 2% NaN3 treatment, scale = 10 μm. The experiment was repeated six times for each condition with similar results. C, D Representative trace of the time course of standardized ΔF/F fluorescence after 30 Hz × 3 s stimulation (open arrowhead), and after NaN3 treatment (black arrowhead) of GCaMP6f (C) and RGEDI (D) expressing neurons. E To determine whether RGEDI signals were specific for cell death and not confounded by physiological Ca2+ transients, the ratio of the maximum signal from electrical stimulation to toxin treatment per neuron are shown, demonstrating that GEDI does not respond to physiological Ca2+ transients (n = 6 cells/group, 1 cell per coverslip, *** Unpaired, two-tailed T-test, p < 0.0001). Error bars represent SEM. F Design of RGEDI-P2a-EGFP cassette for pseudo-ratiometric expression in neurons. G Illustration of color change in red:green image overlay expected in a live versus dead neuron. Live neurons have EGFP (green) and basal RGEDI (red) fluorescence (overlaid as yellow) within the soma of the neuron, surrounded by green fluorescence that expands through the neurites. Dead neurons display yellow fluorescence throughout, with edges of red fluorescence around the soma and throughout degenerating neurites as extracellular Ca2+ permeates the membrane (arrows). H Time course images of rat primary cortical neurons expressing RGEDI-P2a-EGFP at 24–39 h post transfection (hpt). Neuron 1 shows characteristic morphology features of life through 27 hpt at which time it also shows elevated GEDI ratio (yellow asterisk), followed by loss of fluorescence at 39 hpt. Neuron 2 remains alive through time course, scale = 20 μm. Color scales are annotated in arbitrary units for each color channel. I Quantification of change in GEDI ratio of Neurons 1 and 2 in (H). J Quantification of GEDI ratio in rat primary cortical neurons before (blue dots) and from a separate well 5 min after NaN3-induced neuronal death (green dots = live, red dots = dead). The Black dotted line represents the calculated GEDI threshold. (*** One-tailed T-test p < 0.0001). K Quantification and classification of death in neuronal cultures at 24 and 48 h after co-transfection of RGEDI-P2a-EGFP and an N-terminal exon 1 fragment of Huntingtin, the protein that causes Huntington’s disease, with a disease-associated expansion of the polyglutamine stretch (HttEx1Q97) to induce neuronal death using the derived GEDI threshold from (J) to define death. Independently, neurons were scored as dead (red), or live (green) by eye using EGFP at 24, 48, and 72 post transfection. Neurons that were classified as live by eye but above the GEDI threshold and classified as dead at the subsequent time point were called human errors (black).

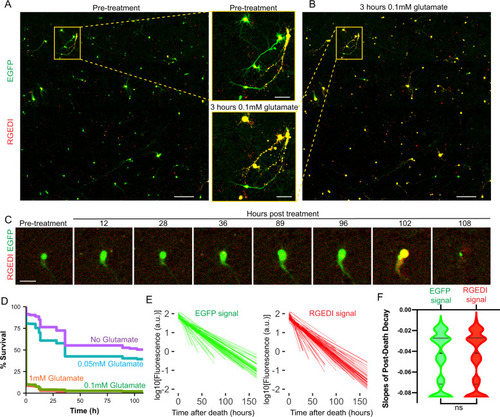
A Representative two-color overlay image from a well of rat primary cortical neurons expressing RGEDI-P2a-EGFP before treatment with 0.1 mM glutamate (Scale = 400 μm) and zoom-in of two individual neurons within the yellow box (Scale = 100 μm). Live neurons appear green/yellow, dead neurons appear yellow/red. B Representative two-color overlay image from neurons 3 h after treatment with 1 mM glutamate and enlargement of the same two neurons within the yellow box in (A). Scale = 100 μm. C Time-course images of a neuron before and after exposure to 0.1 mM glutamate that survives until 96 h post-treatment (Scale = 50 μm). Experiments A–C were repeated on 16 wells with similar results. D Kaplan–Meier plot of neuron survival after exposure to 1, 0.1, 0.01 mM, and 0 glutamate (n = 699, 585, 527, 476). E Linear regressions of decay of EGFP (left) and RGEDI (right) after neuronal death marked by GEDI signal above the threshold. F Slopes of decay of EGFP and RGEDI signals are not different (Mann–Whitney, two-tailed, ns not significant, p = 0.93, n = 5513). Horizontal lines in the violin plots represent quartiles and median.

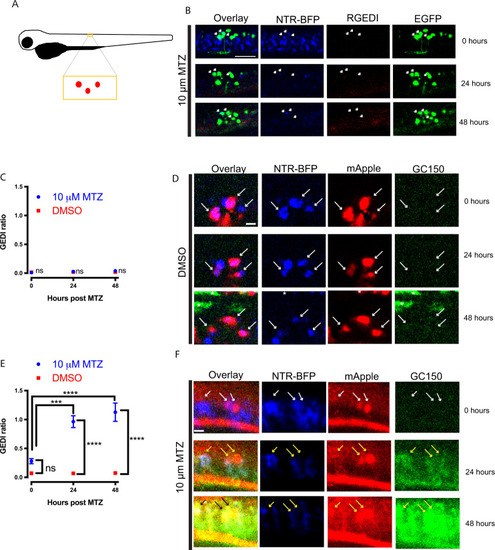
A Representative two-color overlay images of rat primary cortical neuron at 24 and 48 h after transfection co-expressing RGEDI-P2a-EGFP and HttEx1Q97 (A′), α-synuclein (A″), or TDP43 (A″′). The GEDI ratio identifies each neuron as live at 24, but dead at 48 h post transfection. Scale = 25 μm. B Quantification of GEDI ratio during longitudinal imaging across 168 h of live culture of neurons expressing HttEx1Q97 (B), α-synuclein (B′), or TDP43 (B″) with GEDI thresholds at 0.05 for each data set. Dots are color-coded for time post imaging. C Cumulative risk-of-death of HttEx1Q97 (HR = 1.83, 95% CI = 1.67–2.01, Cox proportional hazard (CPH) *p < 0.001), HttEx1Q25 (HR = 1.07, 95% CI = 0.99–1.15, ns not significant, p = 0.08), α-synuclein (HR = 1.73, 95% CI = 1.58–1.89, CPH *p < 0.001), TDP43 (HR = 1.77, 95% CI = 1.6–1.94, CPH *p < 0.001), and RGEDI-P2a-EGFP alone (control) generated from GEDI ratio quantification and classification against the GEDI threshold. The number of neurons in Control = 1670, HttEx1Q25-CFP = 1333, HttEx1Q97-CFP = 668, TDP43 = 610, and α-synuclein = 743. D Representative time-lapse imaging of a control iPSC motor neuron expressing RGEDI-P2a-EGFP that survives throughout imaging. Scale = 25 μm. E Representative time-lapse imaging of a SOD1 D90A iPSC motor neuron that is dead by GEDI signal at 84 h of after transfection. Scale = 25 μm. F Quantification of the GEDI ratio of Control and SOD1 D90A neurons and the derived GEDI threshold at 0.05. G CRD plot of SOD1-D90A and Control (95% CI = 1.11–1.44, CPH p < 0.0001, number of neurons in Control = 714, and SOD1 D90A = 363).

Comparison of GEDI variants to detect neuronal death.

AC Representative images of rat primary cortical neurons expressing RGEDI-P2a-3xBFP (A), mRuby-P2a-GCaMP6f (B), or RGEDI-P2a-EGFP (C), before, 5 min and 10 min after exposure to NaN3. D Quantification of the peak signal and response rate of signal increase (τ) from fitted nonlinear regressions of increases in fluorescence signals over time from variants of the GEDI biosensor: RGEDI-P2a-3xBFP (n = 23), mRuby-P2a-GCaMP6f (n = 52), RGEDI-P2a-EGFP (n = 41), GC150-P2a-mApple, RGEDI-NLS-P2a-EGFP-NLS, and GC150-NLS-P2a-mApple-NLS (n = 40), compared to EGFP-P2a-mApple (n = 18). Error bars represent SE, ANOVA Tukey’s ****p < 0.0001; ns not significant, n values represent individual neurons sampled across at least three independent wells. E Relative fluorescence of GECI’s GCaMP6f79 and RCEPIA36/RGEDI and GCaMP150ER37/GC150 across Ca2+ concentrations modeled from previously reported Hill coefficients and Kd values. F Representative images of rat primary cortical neurons expressing GC150-P2a-mApple, G GC150-NLS-P2a-mApple-NLS, and H RGEDI-NLS-P2a-EGFP-NLS before, 5 min, and 10 min after exposure to NaN3. Error bars represent SEM. Scale = 25 μm. Experiments in AC and FH were repeated at least 18 times with similar results.

Single-cell tracking and specific detection of death within live zebrafish larvae with GC150 but not RGEDI.

A Cartoon schematic of zebrafish larvae showing the approximate location of sparsely labeled clusters of neurons. B Neurons in the zebrafish larvae spinal cord co-expressing NTR-BFP, EGFP, and RGEDI at 0, 24, and 48 h after mounting for automated imaging in MTZ. White arrows indicate neurons co-expressing NTR-BFP and EGFP. Scale = 50 μm. C Quantification of GEDI ratio in neurons co-expressing NTR-BFP and RGEDI-P2a-EGFP exposed to MTZ (n = 7) or DMSO (n = 5) showing no increase in GEDI signal (ANOVA Sidak’s, ns not significant). D Neurons in the zebrafish larvae spinal cord co-expressing NTR-BFP, mApple, and GC150 at 0, 24, and 48 h after mounting for automated imaging in DMSO. White arrows indicate neurons with the fluorescence of BFP and mApple, asterisks indicate autofluorescence from pigment in larvae skin, scale = 20 μm. E Quantification of average GEDI ratio of neurons from zebrafish larvae incubated in DMSO (n = 7) or 10 μM MTZ (n = 17) over time showing an increase in GEDI ratio in neurons indicating neuronal death after 24 h in MTZ (ANOVA Tukey’s ****p < 0.0001, ***p < 0.0005). F Neurons in zebrafish larvae spinal cord co-expressing NTR-BFP, mApple, and GC150 at 0, 24, and 48 h after mounting for automated imaging in 10 μM MTZ. White arrows indicate neurons with the fluorescence of BFP and mApple, yellow arrows indicate neurons with the fluorescence of BFP, mApple, and GC150, indicating neuronal death. Asterisks indicate autofluorescence from pigment in larvae skin, scale = 20 μm. Error bars represent SEM. The experiment was on 12 larvae with similar results.

Acknowledgments
This image is the copyrighted work of the attributed author or publisher, and ZFIN has permission only to display this image to its users. Additional permissions should be obtained from the applicable author or publisher of the image. Full text @ Nat. Commun.