
|
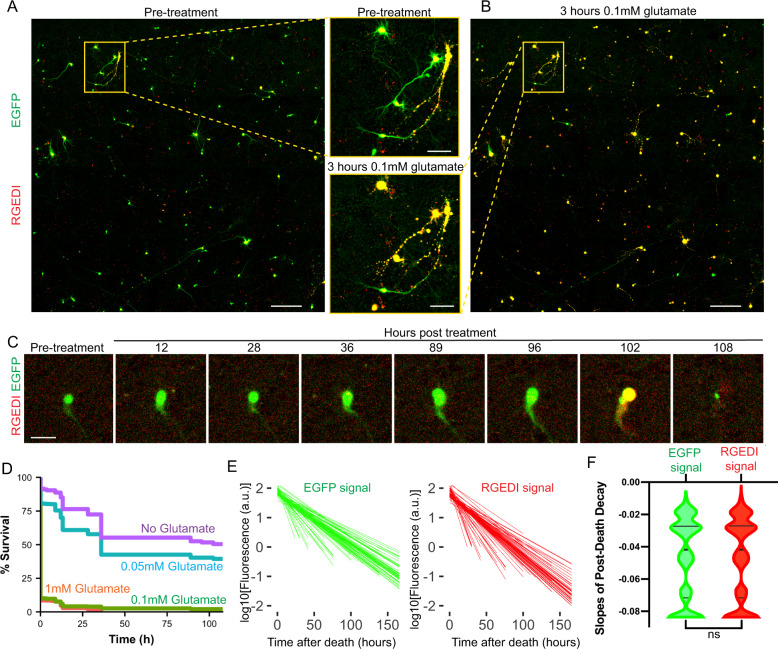
Fig. 2
A Representative two-color overlay image from a well of rat primary cortical neurons expressing RGEDI-P2a-EGFP before treatment with 0.1 mM glutamate (Scale = 400 μm) and zoom-in of two individual neurons within the yellow box (Scale = 100 μm). Live neurons appear green/yellow, dead neurons appear yellow/red. B Representative two-color overlay image from neurons 3 h after treatment with 1 mM glutamate and enlargement of the same two neurons within the yellow box in (A). Scale = 100 μm. C Time-course images of a neuron before and after exposure to 0.1 mM glutamate that survives until 96 h post-treatment (Scale = 50 μm). Experiments A–C were repeated on 16 wells with similar results. D Kaplan–Meier plot of neuron survival after exposure to 1, 0.1, 0.01 mM, and 0 glutamate (n = 699, 585, 527, 476). E Linear regressions of decay of EGFP (left) and RGEDI (right) after neuronal death marked by GEDI signal above the threshold. F Slopes of decay of EGFP and RGEDI signals are not different (Mann–Whitney, two-tailed, ns not significant, p = 0.93, n = 5513). Horizontal lines in the violin plots represent quartiles and median.