
|
Fig. 3
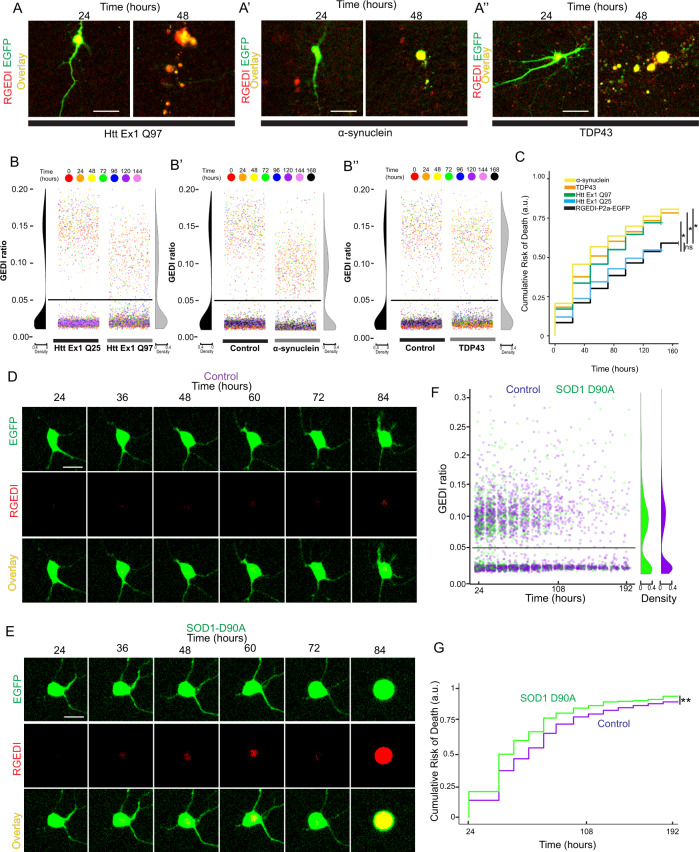
A Representative two-color overlay images of rat primary cortical neuron at 24 and 48 h after transfection co-expressing RGEDI-P2a-EGFP and HttEx1Q97 (A′), α-synuclein (A″), or TDP43 (A″′). The GEDI ratio identifies each neuron as live at 24, but dead at 48 h post transfection. Scale = 25 μm. B Quantification of GEDI ratio during longitudinal imaging across 168 h of live culture of neurons expressing HttEx1Q97 (B), α-synuclein (B′), or TDP43 (B″) with GEDI thresholds at 0.05 for each data set. Dots are color-coded for time post imaging. C Cumulative risk-of-death of HttEx1Q97 (HR = 1.83, 95% CI = 1.67–2.01, Cox proportional hazard (CPH) *p < 0.001), HttEx1Q25 (HR = 1.07, 95% CI = 0.99–1.15, ns not significant, p = 0.08), α-synuclein (HR = 1.73, 95% CI = 1.58–1.89, CPH *p < 0.001), TDP43 (HR = 1.77, 95% CI = 1.6–1.94, CPH *p < 0.001), and RGEDI-P2a-EGFP alone (control) generated from GEDI ratio quantification and classification against the GEDI threshold. The number of neurons in Control = 1670, HttEx1Q25-CFP = 1333, HttEx1Q97-CFP = 668, TDP43 = 610, and α-synuclein = 743. D Representative time-lapse imaging of a control iPSC motor neuron expressing RGEDI-P2a-EGFP that survives throughout imaging. Scale = 25 μm. E Representative time-lapse imaging of a SOD1 D90A iPSC motor neuron that is dead by GEDI signal at 84 h of after transfection. Scale = 25 μm. F Quantification of the GEDI ratio of Control and SOD1 D90A neurons and the derived GEDI threshold at 0.05. G CRD plot of SOD1-D90A and Control (95% CI = 1.11–1.44, CPH p < 0.0001, number of neurons in Control = 714, and SOD1 D90A = 363).