- Title
-
Establishment of a Ciliogenesis-Associated Signaling Model for Polycystic Kidney Disease
- Authors
- Lu, L., Liu, Q., Zhi, L., Che, X., Xiao, B., Cui, M., Yu, M., Yang, B., Zhang, J., Zhang, B.
- Source
- Full text @ Kidney Blood Press. Res.
|
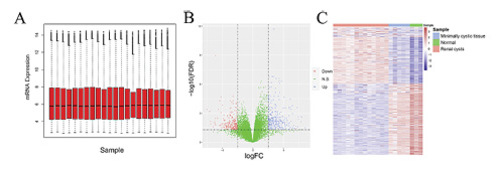
The analysis of differential gene for PKD. A The standardization of the gene chip data. B The volcano map of differentially expressed genes. The horizontal axis represents the multiple of differential expression (Log2FC), the vertical axis represents −log10 (FDR), while the blue dot represents 363 upregulated genes, and the red dot represents 286 downregulated genes, respectively. C The heat map of differentially expressed genes. The horizontal axis indicates the sample, vertical axis indicates different genes, while red is high gene expression, and blue is low gene expression, respectively. PKD, polycystic kidney disease. |
|
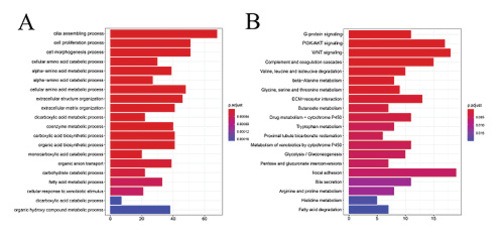
GO and KEGG enrichment results for PKD. A The top 20 GO term enrichment results with the largest number of genes. In the figure, the horizontal axis represents the number of enriched genes, and the vertical axis represents the name of each GO term, respectively. B The enrichment results of the 20 KEGG pathways with the largest number of genes. The horizontal axis in the figure indicates the number of genes enriched, and the vertical axis indicates the name of each KEGG pathway, respectively. PKD, polycystic kidney disease. |
|
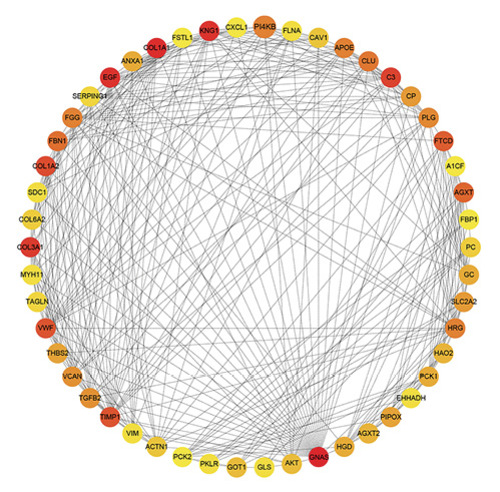
The PPI network diagram of key genes related to PKD. Each dot represents a node. PPI, protein-protein interaction; PKD, polycystic kidney disease. |
|
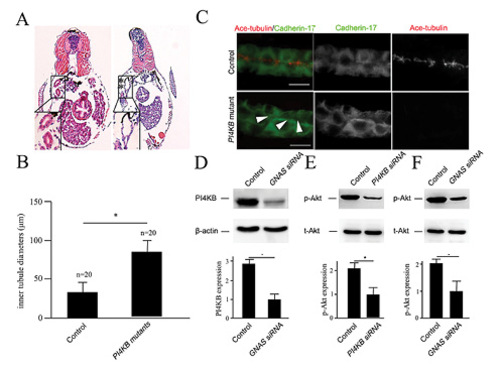
Functional verification of PI4KB for PKD. A The PKD phenotypes generated by PI4KB mutants. The asterisk indicates dilated tubules. B The statistical analysis for PKD phenotypes compared mutants with sibling controls. C The immunostaining of primary cilia for PI4KB mutant zebrafish. The white arrow represents the absence of single cilia in the pronephric duct of mutant zebrafish. D Western blotting and corresponding densitometry analysis demonstrate the expression level of PI4KB in the control vector and GNAS siRNA-transfected HK-2 cells. E, F Western blotting shows the activity change of t-Akt and p-Akt in the control vector, PI4KB siRNA, and GNAS siRNA-transfected HK-2 cells, respectively. The asterisk indicates p < 0.05. t-Akt, total Akt; p-Akt, phospho Akt. PHENOTYPE:
|
|
Schematic illustration of the signaling model from this study. |


