
Fig. 1
- ID
- ZDB-IMAGE-230115-71
- Publication
- Lu et al., 2021 - Establishment of a Ciliogenesis-Associated Signaling Model for Polycystic Kidney Disease
- All Figures
- Figures for Lu et al., 2021
|
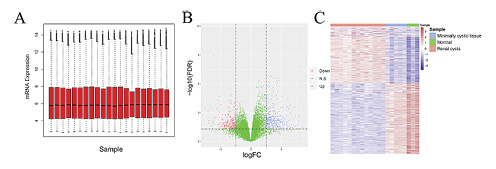
Fig. 1 The analysis of differential gene for PKD. A The standardization of the gene chip data. B The volcano map of differentially expressed genes. The horizontal axis represents the multiple of differential expression (Log2FC), the vertical axis represents −log10 (FDR), while the blue dot represents 363 upregulated genes, and the red dot represents 286 downregulated genes, respectively. C The heat map of differentially expressed genes. The horizontal axis indicates the sample, vertical axis indicates different genes, while red is high gene expression, and blue is low gene expression, respectively. PKD, polycystic kidney disease.