
FIGURE
Fig. 2
- ID
- ZDB-FIG-230115-72
- Publication
- Lu et al., 2021 - Establishment of a Ciliogenesis-Associated Signaling Model for Polycystic Kidney Disease
- Other Figures
- All Figure Page
- Back to All Figure Page
Fig. 2
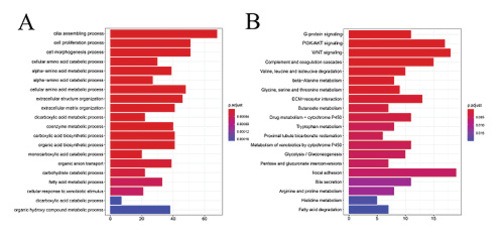
GO and KEGG enrichment results for PKD. A The top 20 GO term enrichment results with the largest number of genes. In the figure, the horizontal axis represents the number of enriched genes, and the vertical axis represents the name of each GO term, respectively. B The enrichment results of the 20 KEGG pathways with the largest number of genes. The horizontal axis in the figure indicates the number of genes enriched, and the vertical axis indicates the name of each KEGG pathway, respectively. PKD, polycystic kidney disease. |
Expression Data
Expression Detail
Antibody Labeling
Phenotype Data
Phenotype Detail
Acknowledgments
This image is the copyrighted work of the attributed author or publisher, and
ZFIN has permission only to display this image to its users.
Additional permissions should be obtained from the applicable author or publisher of the image.
Full text @ Kidney Blood Press. Res.