
- Title
-
Development and genetics of red coloration in the zebrafish relative Danio albolineatus
- Authors
- Huang, D., Lewis, V.M., Foster, T.N., Toomey, M.B., Corbo, J.C., Parichy, D.M.
- Source
- Full text @ Elife
( |
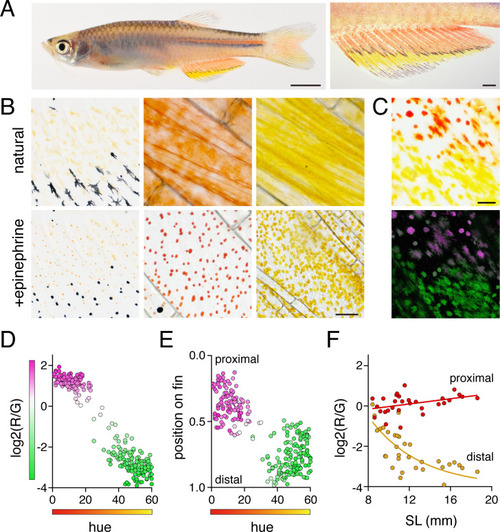
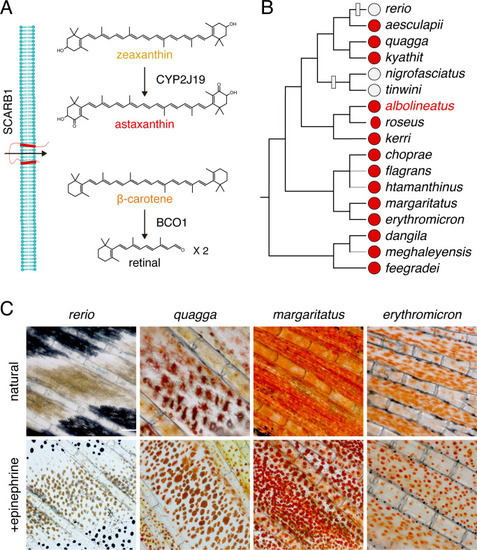
(A) Erythrophores were present on the body and were particularly evident on the anal fin (closeup at right), where these cells were found more proximally than yellow xanthophores. (B) At larval stages xanthophore-like cells with a uniform orange coloration occurred across the entire fin (left panels). Later in the adult, proximal red erythrophores and distal yellow xanthophores have distinct colors (middle and right panels). (C) Erythrophores and xanthophores had different spectra under epiflourescence. Erythrophores autofluorescenced in red (displayed in magenta) whereas xanthophores autofluoresced in green. (D) Hue values under brightfield illumination were correlated with ratios of red to green autofluorescence (R2 = 0.92, p < 0.0001). (E) Colors of cells varied across the proximodistal axis of the fin, shown as relative position with fin base at 0 and fin tip at 1. Erythrophores in proximal regions were distinct in both fluorescence ratio and visible hue from xanthophores in distal regions though some intergradation was evident in middle regions, near the melanophore stripe. N = 250 cells from five adult males in D and E. Color fills represent red to green fluorescence ratios. (F) During the larva-to-adult transformation, ratios of red to green autofluorescence diverged between prospective erythrophore and xanthophore regions. Individual red and yellow points correspond to mean values of cells in in proximal and distal regions, respectively, from each of 31 male or female fish (N = 620 cells total) imaged at a range of developmental stages represented by different standard lengths (SL). Scale bars: 5 mm (A, left), 1 mm (A, right); 25 μm (B, C).
|

(A) In fish mosaic for somatically induced mutations in scarb1 most rare, wild-type clones consisted of both erythrophores and xanthophores (8 of 10 presumptive clones in seven fish, with remaining clones only containing one or the other cell type; an additional 56 fish derived from injected embryos either lacked wild-type cells or lacked mutant cells and were thus uninformative). (B) Clonal labeling of xanthophores and erythrophores with aox5:palmEGFP, illustrating flourescence, brightfield, and merged views of the same fields. In the clone shown here, an initial complement of several orange cells at the level of the melanophore stripe (d0, 7.5 mm SL) expanded to include more cells proximally and distally to the melanophore stripe that differentiated as erythrophores and xanthophores, respectively (d36, 15 mm SL; red arrowheads). For these analyses, limiting dilutions of aox5:palmEGFP were injected into ~500 embryos, yielding 271 embryos that exhibited some fluorescence at 3 days post-fertilization that were further sorted at 16 dpf, identifying 27 individuals with patches of expression in the anal fin. Of these 27 fish, one subsequently died and eight were found to have broad expression across the entire fin, likely representing multiple clones of uncertain boundaries, and so were excluded from analysis. The remaining 18 fish exhibited 24 spatially distinct, presumptive clones of aox5:palmEGFP-labeled cells, of which 22 presumptive clones contained both erythrophores and xanthophores as shown here [consistent with mixed clones of melanophores and xanthophores in zebrafish (Tu and Johnson, 2010; Tu and Johnson, 2011)]; one clone contained only erythrophores and one clone contained only xanthophores. (C) When aox5:nucEosFP+ cells on the body were bulk photoconverted before fin development, only unconverted aox5:nucEosFP+ cells (green nuclei) were present in the fin 4 days later (images representative of all N = 3 fish tested). (D) Successive steps in anal fin development and erythrophore/xanthophore lineage specification revealed many cells newly acquiring aox5:nucEosFP expression at daily intervals within the fin (green nuclei). Though some aox5:nucEosFP+ cells were present at the fin base these did not enter into the fin proper (white cells, arrowheads; images shown are from a single individual representative of all N = 7 fish tested in this manner over 23 days each). Scale bars: 200 μm (A, B); 100 μm (C, D).
|

(A) Unpigmented cells of the xanthophore lineage, marked by aox5:nucEosFP transgene expression (see Main text), present at 7.0 mm SL had acquired a pale orange color 1 day later. (Representative of all N = 7 fish examined by repeated imaging during larval development.) Insets show higher magnification images of a corresponding region. (B) Example of a photoconverted, initially unpigmented cell (d0, 7.0 mm SL) that yielded a clone containing both erythrophores and xanthophores (d35, 15.0 mm SL; representative of four of seven clones, with remaining clones containing erythrophores only). Fish were treated with epinephrine to contract pigment before imaging. Arrows indicate erythrophore autofluorescence from red carotenoid pigment, which accumulates adjacent to nuclei following epinephrine treatment; approximate positions of nucEosFP+ nuclei in brightfield images are shown with dashed outlines. Insets, proximal and distal cells in the clone. (C) Percentages of clones containing only erythrophores, only xanthophores, or both cell types. Numbers above bars indicate clone sample sizes examined. In these analyses pigment cells and progenitors stably expressed aox5:nucEosFP (7.5, 8.5 mm SL) or mosaically expressed a different transgene, mitfa:nucEosFP (7.0 mm SL), that had been injected into embryos at the one-cell stage. In zebrafish, mitfa (melanophore-inducing transcription factor a) is expressed by pigment cell progenitors, as well as melanophores and xanthophores (Lister et al., 1999; Saunders et al., 2019), and we found in D. albolineatus that mitfa:nucEosFP was expressed in these cells as well as orange cells of larvae and erythrophores of adults. mitfa:nucEosFP was used for fate mapping at early stages owing to its more robust expression in unpigmented cells. Scale bar: 50 μm.
|
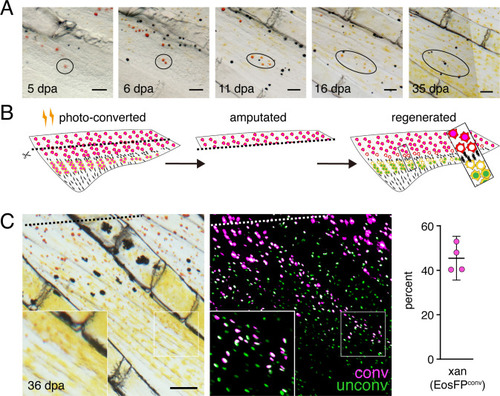
(A) Brightfield sequence of regeneration illustrating apparent conversion of erythophores to xanthophores (image series representative of all N = 3 fish examined by repeated imaging through regeneration). As fins regenerated, individual erythrophores (circled) near the amputation plane appeared to divide, with presumptive daughter cells having reduced amounts of pigment visible upon contraction with epinephrine and an increasingly yellow–orange color. (B) Schematic of regeneration experiment in C. Fins of Tg(aox5:nucEosFP) fish were photo-converted in toto prior to amputation through the erythrophore region. Fins regenerated over 15 days and pigment pattern had re-formed by 30 days, at which time a new melanophore stripe and distinct regions of erythrophores and xanthophores had developed. (C) Example of cells in regenerative tissue 36 days post-amputation (dpa). Regenerative xanthophores near the plane of amputation often contained photoconverted nucEosFP in a region of fin extending 400 μm from the distalmost red erythrophore into the regenerative xanthophore region (means ± 95% confidence interval; N = 1964 cells in four fish examined). Dashed lines indicate amputation in B and C. Scale bars: 50 μm (A); 100 μm (C).
|
( |
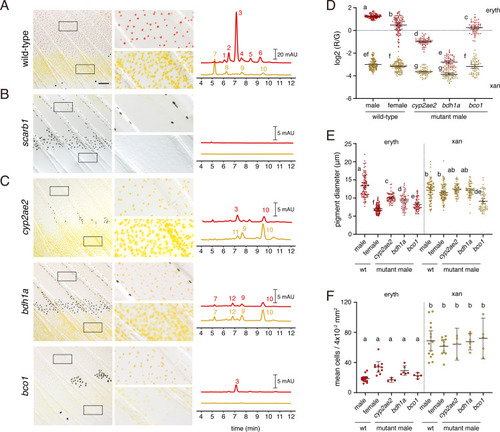
(A) Wild-type fin and carotenoid profile, showing carotenoid absorbance at 455 nm in adult male proximal tissue (red) and distal tissue (yellow). Numbers indicate different carotenoid species, with the most abundant ketocarotenoid in erythrophore-containing tissue being astaxanthin (peak 3; Figure 1A; Figure 7—figure supplement 1). (B) Homozygous scarb1 mutants lacked red and yellow coloration and carotenoids were not detectable. (C) Homozygous mutant phenotypes of genes targeted from RNA-Seq comparisons. cyp2ae2 and bdh1a mutants were deficient for red color and astaxanthin. bco1 mutants had reduced red and yellow coloration and carotenoids. (D) Ratios of red to green autofluorescence for cells found within proximal erythrophore containing regions (red filled points) and distal xanthophore containing regions (yellow filled points) of wild-type males and females compared to mutant males. In the wild-type, erythrophores and xanthophores were segregated into different populations by R/G fluorescence, although differences in females were less marked. In males of each mutant, R/G ratios of erythrophores were reduced compared to wild-type, and lesser reductions were evident in xanthophores (ANOVA, genotype x region interaction, F4,736=310.82, p < 0.0001, after controlling for significant main effects and variation among individuals; N = 760 cells total from five individuals of each background). Plots show means ±95 % confidence intervals; means of groups not sharing the same letter differed significantly from one another (p < 0.05) in Tukey-Kramer post hoc comparisons. (E) Wild-type males and females, and mutant males, differed in total visible pigment, as measured by diameters of contracted pigment granules following epinephrine treatment (Saunders et al., 2019). (ANOVA, background x region interaction, F4,736=76.25, p < 0.0001, with significant main effects and variation among individuals; diameters were ln-transformed for analysis to control for increasing residual variance with means.). (F) Densities of erythrophores and xanthophores differed across backgrounds ( ANOVA, background x region interaction, F1,35=19.01, p < 0.0001). Each point represents the mean number of cells counted in three regions of 4 × 10⁻² mm2 in proximal or distal regions with erythrophores or xanthophores, respectively, in each of 39 total fish. Scale bar: 50 μm.
|