Figure 3
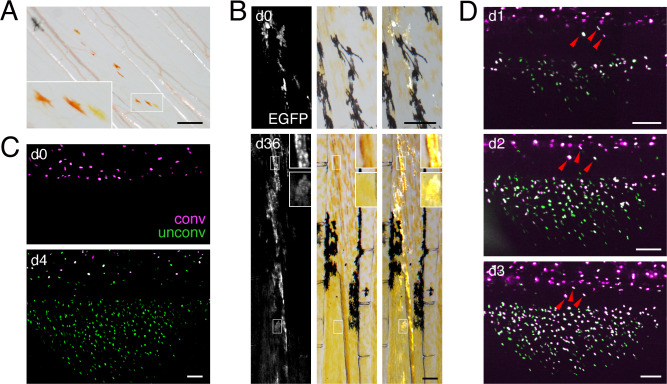
(A) In fish mosaic for somatically induced mutations in scarb1 most rare, wild-type clones consisted of both erythrophores and xanthophores (8 of 10 presumptive clones in seven fish, with remaining clones only containing one or the other cell type; an additional 56 fish derived from injected embryos either lacked wild-type cells or lacked mutant cells and were thus uninformative). (B) Clonal labeling of xanthophores and erythrophores with aox5:palmEGFP, illustrating flourescence, brightfield, and merged views of the same fields. In the clone shown here, an initial complement of several orange cells at the level of the melanophore stripe (d0, 7.5 mm SL) expanded to include more cells proximally and distally to the melanophore stripe that differentiated as erythrophores and xanthophores, respectively (d36, 15 mm SL; red arrowheads). For these analyses, limiting dilutions of aox5:palmEGFP were injected into ~500 embryos, yielding 271 embryos that exhibited some fluorescence at 3 days post-fertilization that were further sorted at 16 dpf, identifying 27 individuals with patches of expression in the anal fin. Of these 27 fish, one subsequently died and eight were found to have broad expression across the entire fin, likely representing multiple clones of uncertain boundaries, and so were excluded from analysis. The remaining 18 fish exhibited 24 spatially distinct, presumptive clones of aox5:palmEGFP-labeled cells, of which 22 presumptive clones contained both erythrophores and xanthophores as shown here [consistent with mixed clones of melanophores and xanthophores in zebrafish (Tu and Johnson, 2010; Tu and Johnson, 2011)]; one clone contained only erythrophores and one clone contained only xanthophores. (C) When aox5:nucEosFP+ cells on the body were bulk photoconverted before fin development, only unconverted aox5:nucEosFP+ cells (green nuclei) were present in the fin 4 days later (images representative of all N = 3 fish tested). (D) Successive steps in anal fin development and erythrophore/xanthophore lineage specification revealed many cells newly acquiring aox5:nucEosFP expression at daily intervals within the fin (green nuclei). Though some aox5:nucEosFP+ cells were present at the fin base these did not enter into the fin proper (white cells, arrowheads; images shown are from a single individual representative of all N = 7 fish tested in this manner over 23 days each). Scale bars: 200 μm (A, B); 100 μm (C, D).
Shared progenitor of fin erythrophores and xanthophores revealed by clonal analyses.
Image
Figure Caption
Acknowledgments
This image is the copyrighted work of the attributed author or publisher, and
ZFIN has permission only to display this image to its users.
Additional permissions should be obtained from the applicable author or publisher of the image.
Full text @ Elife

