FIGURE SUMMARY
Title

Probing Synergistic Targets by Natural Compounds for Hepatocellular Carcinoma

Authors
Gao, J., Yin, Z., Wu, Z., Sheng, Z., Ma, C., Chen, R., Zhang, X., Tang, K., Fei, J., Cao, Z.
Source
Full text @ Front Cell Dev Biol

CBE synergisti cally inhibited the growth of BEL-7402 cells. (A) The chemical structure of BER and EVO. (B) Dose-response curves of BER, EVO, and CBE in BEL-7402 cells. Cells were treated with BER, EVO, or CBE for 48 h. To prepare CBE, a constant ratio (BER/EVO = 10:1) was used, and the curve was plotted against BER concentration. Cell viability was determined by MTT assay. (C) Isobologram for CBE at the dose ratio of 10:1. The red line represents the intercept line of the IC50 values for BER or EVO alone, and the “×” indicates the IC50 value for CBE at the dose ratio of 10:1. CI < 1, CI = 1, and CI > 1 indicate synergism, an additive effect, and antagonism, respectively. (D) The Venn plot of DEGs under the treatments of BER, EVO, and CBE.

The detection of key players in CBE treatment based on differential signaling network. (A) Predicted signaling transduction network inferred for CBE treatment. Red boxes indicate upregulation, and blue boxes indicate downregulation under CBE treatment compared to blank control. Key points are highlighted in yellow. (B) Changes in the transcriptional activity of NF-κB and AP-1 by BER, EVO, or CBE treatment. BEL-7402 cells were transfected with the reporter construct for 24 h and then treated with BER, EVO, or CBE for 12 h. For each sample, firefly luciferase activity is presented as normalized to Renilla luciferase activity. The results from each group are presented as the mean ± SD of at least three samples. The drug dose was equal to that used the in the RNA-seq experiment. Columns, mean; bars, SD (t-test; *p < 0.05; **p < 0.01).

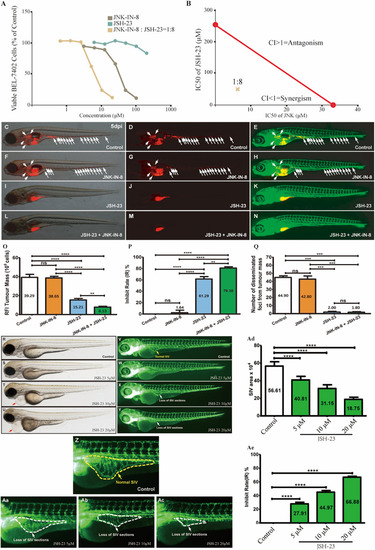
Coinhibition of NF-κB and c-JUN synergistically suppressed HCC growth and in vitro and in vivo. (A) The dose-response curves for each inhibitor alone or in combination. For the combination, the x-axis represents the concentration of JNK-IN-8. (B) Isobologram for the combination of JNK-IN-8 and JSH-23 in BEL-7402 cells. The red line represents the intercept line of the IC50 values for JNK-IN-8 and JSH-23 alone, and the “×” indicates the IC50 value for the two inhibitors at a dose ratio of 1:8. CI < 1, = 1, and > 1 indicate synergism, an additive effect, and antagonism, respectively. (C–E,F–H,I–K,L–N) Treatments administered to a zebrafish tumor xenograft model were vehicle control, JNK-IN-8 (10 μM) alone, JSH-23 (5 μM) alone, and JNK-IN-8 (10 μM) combined with JSH-23 (5 μM). BEL-7402 cells were labeled with CM-DiI red fluorescence dye, and white arrowheads indicate disseminated tumor foci in 5-dpi zebrafish embryos. (O–Q) Quantification of the tumor mass, the inhibition rate, and the number of disseminated tumor foci. (R–Ac) Representative bright field and fluorescent images of control embryos or embryos treated with JSH-23 at 4 days post-fertilization (dpf). In control embryos, SIVs developed as a smooth basket-like structure over the yolk at 4 dpf (V,Z, yellow dashed lines). In contrast, the treatment of embryos with JSH-23 resulted in specific defects in SIV formation (W–Y,Aa–Ac, white dashed lines). Treatment with 10 μM JSH-23 for 48 h caused pericardial edema (red arrow). The complications were caused by vascular defects in the SIV (white arrow). (Ad,Ae) Quantification of the SIV area shows a significant decrease in the SIV area in JSH-23-treated embryos compared to control embryos. RFI, relative fluorescence intensity; dpi, days post-injection. Columns, mean; bars, SEM (n = 10; ANOVA; **p < 0.01, ***p < 0.001, ****p < 0.0001).

Liver cancer patients with low NF-κB and JNK expression showed a better prognosis and decreased proliferation. (A) Survival analysis of samples from patients with low expression of both NF-κB1 and JNK (group 1) and other types of samples. (B) Differential expression of Ki-67 in five types of samples. NF-κBLOW and NF-κBHIGH represent samples from patients whose NF-κB expression level is lower or higher, respectively, than the cutoff value of 6.18. JNKLOW and JNKHIGH represent samples from patients whose NF-κB expression level is lower or higher, respectively, than the cutoff value of 3.06. The light gray dotted line represents the median survival time of each group. Columns, median (t-test; **p < 0.01, ***p < 0.001, ****p < 0.0001).

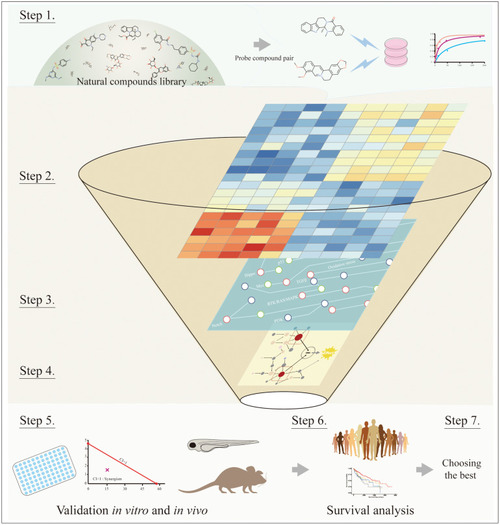
The workflow of systematic processes to identify key synergy-mediated players. Step 1: Choosing the natural compound pair from the natural compounds library. Step 2: Obtaining DEGs from transcriptomics or proteomics profiling. Step 3: Mapping DEGs to cancer signaling transduction networks. Step 4: Inferring key synergy-mediating targets among DEGs based on network topology and empirical experience. Step 5: Validating suspected targets through in vitro and in vivo experiments. Step 6: Conducting survival analysis in clinical samples. Step 7: Choosing the best candidates.

Acknowledgments
This image is the copyrighted work of the attributed author or publisher, and ZFIN has permission only to display this image to its users. Additional permissions should be obtained from the applicable author or publisher of the image. Full text @ Front Cell Dev Biol