FIGURE SUMMARY
Title

Poria cum Radix Pini Rescues Barium Chloride-Induced Arrhythmia by Regulating the cGMP-PKG Signalling Pathway Involving ADORA1 in Zebrafish

Authors
Yang, N.J., Liu, Y.R., Tang, Z.S., Duan, J.A., Yan, Y.F., Song, Z.X., Wang, M.G., Zhang, Y.R., Chang, B.J., Zhao, M.L., Zhao, Y.T.
Source
Full text @ Front Pharmacol

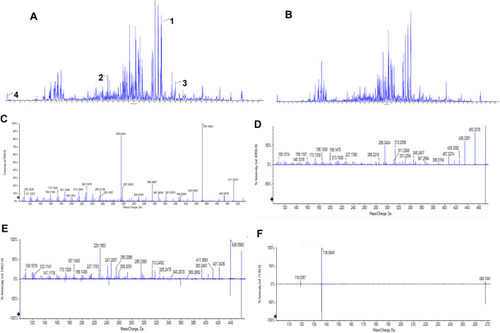
UPLC/Q-TOF-MS total ion current chromatogram of the PRP alcohol extract. (A) Total ion current chromatogram in positive ion mode. Numbers represent the following compounds:1. Pachymic acid, 2. Glycyrrhetinic acid, 3. Oleanolic acid, 4. Adenosine. (B) Total ion current chromatogram in negative mode. The retention times of the four compounds were 30.317, 19.867, 33.012, and 0.55 min, respectively. (C) MS/MS spectrum of pachymic acid; (D) MS/MS spectrum of glycyrrhetinic acid; (E) MS/MS spectrum of oleanolic acid; (F) MS/MS spectrum of adenosine.

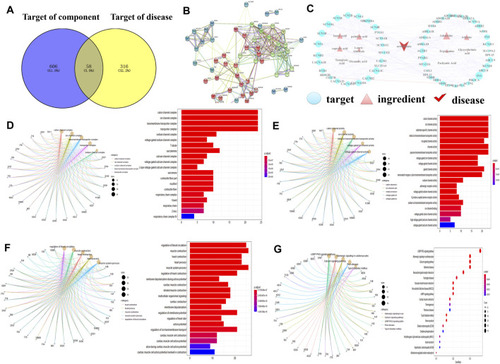
Network pharmacology prediction results. (A) ‘Component-disease-target’ intersection Venn diagram. (B) Intersection target PPI diagram. The closer the nodes were, the more likely they were to appear red. The larger the nodes, the closer the relationship was between the corresponding targets and other targets in the network. (C) ‘Component-disease-target’ network correlation diagram. (D) GO enrichment analysis - cellular component (CC). (E) GO enrichment analysis - molecular function (MF). (F) GO enrichment analysis - biological process (BP). (G) KEGG metabolic pathway analysis. Gene symbols were presented by PubMed Entrez ID.

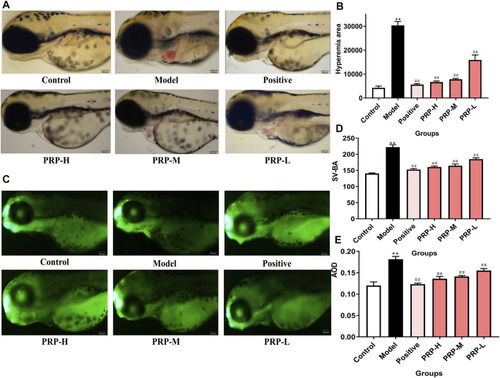
The effect of PRP on the heart development of zebrafish embryos following barium chloride treatment. (A) Morphological observations of the heart development of zebrafish embryos under a microscope, with the heart shown in the yellow box (X10). (B) The cardiac congestion area of zebrafish embryos was calculated. (C) The results of acridine orange staining. The apoptosis of zebrafish embryos cardiomyocytes observed under fluorescence microscopy is shown in the yellow box (X10). (D) The SV-BA distance was measured. (E) The average fluorescence density was calculated.All data are presented as means ± SD, n = 6. *p < 0.05, **p < 0.01, control versus model; #p < 0.05, ##p < 0.01, model versus positive, PRP-H, PRP-M, and PRP-L.

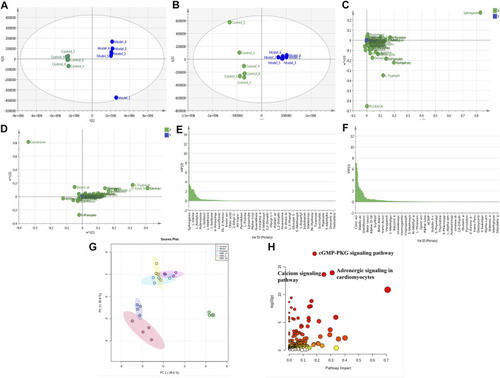
Effects of PRP on metabolite alterations induced by barium chloride in zebrafish embryos. R2Y = 0.999, Q2 = 0.995 in positive ion mode; R2Y = 0.986, Q2 = 0.984 in negative ion mode; (A) 2D scores plot in positive ion mode; (B) 2D scores plot in negative ion mode; (C) Loading plot in positive ion mode; (D) Loading plot in negative ion mode; (E) VIP diagram in positive ion mode; (F) VIP diagram in negative ion mode; (G) PCA scores plot of different metabolites in each group; (H) Metabolic pathway enrichment analysis diagram.

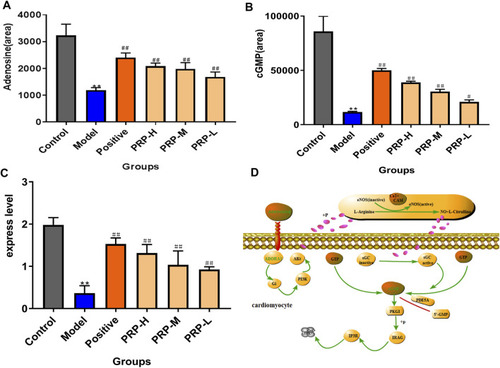
PRP-mediated regulation of the levels of adenosine and cGMP metabolites and the expression level of ADORA1 in the cGMP-PKG signalling pathway. (A) Quantitative evaluation of adenosine metabolism; (B) quantitative evaluation of cGMP metabolic levels; (C) expression levels of ADORA1 in zebrafish determined by reverse transcription polymerase chain reaction; (D) ADORA1-mediated cGMP-PKG pathway map.

Acknowledgments
This image is the copyrighted work of the attributed author or publisher, and ZFIN has permission only to display this image to its users. Additional permissions should be obtained from the applicable author or publisher of the image. Full text @ Front Pharmacol