IMAGE

FIGURE 2

ID
ZDB-IMAGE-210818-10
Source
Figures for Yang et al., 2021
Image
Figure Caption

FIGURE 2

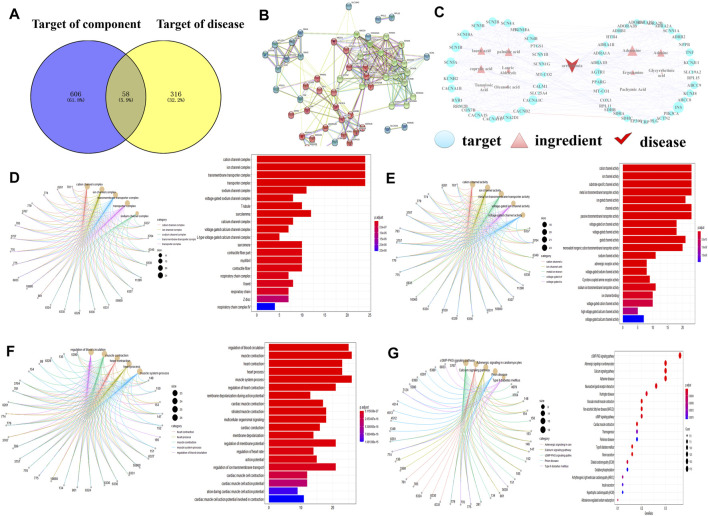
Network pharmacology prediction results. (A) ‘Component-disease-target’ intersection Venn diagram. (B) Intersection target PPI diagram. The closer the nodes were, the more likely they were to appear red. The larger the nodes, the closer the relationship was between the corresponding targets and other targets in the network. (C) ‘Component-disease-target’ network correlation diagram. (D) GO enrichment analysis - cellular component (CC). (E) GO enrichment analysis - molecular function (MF). (F) GO enrichment analysis - biological process (BP). (G) KEGG metabolic pathway analysis. Gene symbols were presented by PubMed Entrez ID.

Acknowledgments
This image is the copyrighted work of the attributed author or publisher, and ZFIN has permission only to display this image to its users. Additional permissions should be obtained from the applicable author or publisher of the image. Full text @ Front Pharmacol