
Image
|
Figure Caption
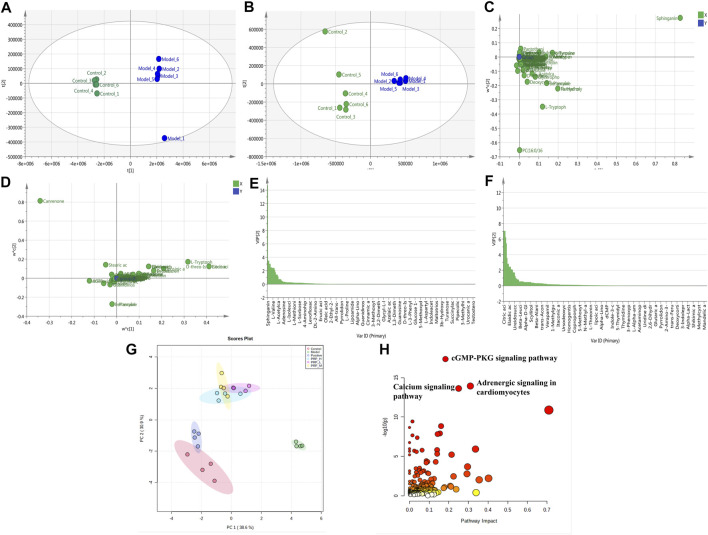
FIGURE 4
Effects of PRP on metabolite alterations induced by barium chloride in zebrafish embryos. R2Y = 0.999, Q2 = 0.995 in positive ion mode; R2Y = 0.986, Q2 = 0.984 in negative ion mode;
Acknowledgments
This image is the copyrighted work of the attributed author or publisher, and
ZFIN has permission only to display this image to its users.
Additional permissions should be obtained from the applicable author or publisher of the image.
Full text @ Front Pharmacol