
- Title
-
Differential influences of (±) anatoxin-a on photolocomotor behavior and gene transcription in larval zebrafish and fathead minnows
- Authors
- Lovin, L.M., Kim, S., Taylor, R.B., Scarlett, K.R., Langan, L.M., Chambliss, C.K., Chatterjee, S., Scott, J.T., Brooks, B.W.
- Source
- Full text @ Environ Sci Eur

Photomotor response and total locomotor behavior of unexposed zebrafish (a, b) and fathead minnows (c, d). a and c show photomotor response measured as the change in mean (± SE) total distance traveled between the last minute of the prior photoperiod and the first minute of the following period. b, d show mean (± SE) distance swam at each minute interval. Dark gray bars represent activity in the dark and the white bars represent activity in the light. A total of 24 zebrafish (4 replicates each with 6 larvae) and 12 fathead minnows (3 replicates with 4 larvae) were used for baseline behavioral observation |
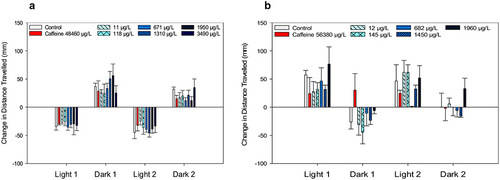
Photomotor response of zebrafish (a) and fathead minnow (b) exposed to caffeine or (±) anatoxin-a measured as the change in mean (± SE) total distance traveled between the last minute of the prior photoperiod and the first minute of the following period. A total of 24 zebrafish (4 replicates each with 6 larvae) and 12 fathead minnows (3 replicates with 4 larvae) were used for each treatment level |
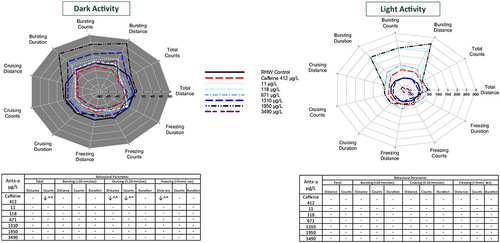
Behavioral response profiles of mean zebrafish swimming movement and speed in the dark (a) and in the light (b) each comprising 20 min (2 intervals of 10 min) after 96 h exposure to (±) anatoxin-a or caffeine. Behavioral parameters include swim distance, number of changes in movement (count), and swim duration in total and across 3 speeds, bursting (> 20 mm/s), cruising (5–20 mm/s), and freezing (< 5 mm/s). The tables below the graphs indicate a significant increase (↑) or decrease (↓) in activity compared to the negative control. In the (±) antx-a treatments, ANOVA and Dunnett’s post hoc were used to analyze treatment level responses compared to the negative control (*p < 0.10; **p < 0.05; ***p < 0.01). T tests were used to analyze caffeine influences compared to the negative control (^ p < 0.10; ^^ p < 0.05; ^^^ p < 0.01). A total of 24 zebrafish (4 replicates each with 6 larvae) were used for each treatment level |
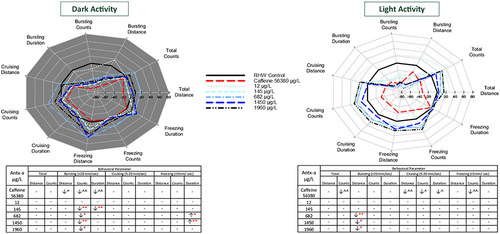
Behavioral response profiles of mean fathead minnow swimming movement and speed in the dark (a) and in the light (b) each comprising 20 min (2 intervals of 10 min) after 96-h exposure to (±) anatoxin-a or caffeine. Behavioral parameters include swim distance, number of changes in movement (count), and swim duration in total and across 3 speeds, bursting (> 20 mm/s), cruising (5–20 mm/s), and freezing (< 5 mm/s). The tables below the graphs indicate a significant increase (↑) or decrease (↓) in activity compared to the negative control. In the (±) antx-a treatments, ANOVA and Dunnett’s post hoc were used to analyze treatment level responses compared to the negative control (*p < 0.10; ** p < 0.05; ***p < 0.01), T tests were used to identify potential caffeine influences compared to the negative control (^ p < 0.10; ^^ p < 0.05; ^^^ p < 0.01). A total 12 fathead minnows (3 replicates with 4 larvae) were used for each treatment level |
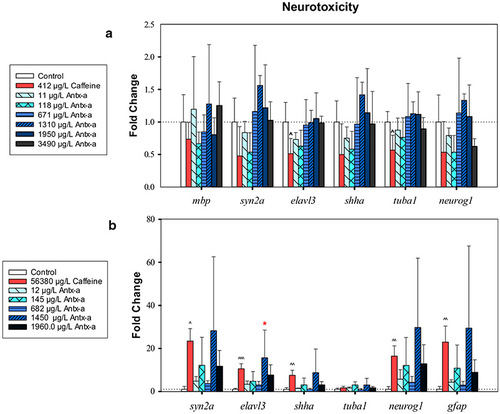
RT-qPCR neurotoxicity-related gene expression data for zebrafish (a) or fathead minnows (b) exposed for 96 h to (±) antx-a or caffeine compared to the negative control. Transcript levels were normalized to housekeeping gene, elongation factor 1 alpha in zebrafish and 18s ribosomal RNA in fathead minnow, using the 2−ΔΔCT method. In the (±) antx-a treatments, ANOVA and Dunnett’s post hoc were used to analyze treatment level responses compared to the negative control (*p < 0.05; **p < 0.01; ***p < 0.001). T tests were used identify potential caffeine influences compared to the negative control ^ p < 0.05; ^^ p < 0.01; ^^^ p < 0.001, error bars (± SD). Zebrafish included 4 replicates with 21–24 larvae used for each treatment level. Fathead minnows included 4 replicates with 13–15 larvae used for each treatment level |
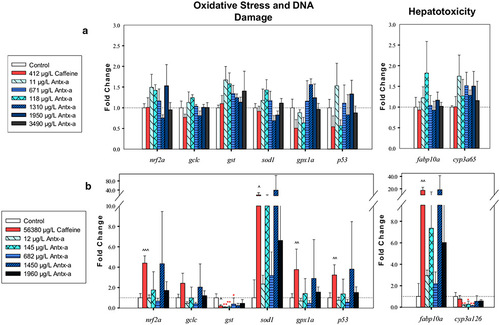
RT-qPCR oxidative stress, DNA damage, and hepatotoxicity gene expression data comparing larval fathead minnows exposed for 96 h to (±) antx-a or caffeine compared to the negative control. For zebrafish (a) or fathead minnows (b) exposed for 96 h to (±) antx-a or caffeine compared to the negative control. Transcript levels were normalized to housekeeping gene, elongation factor 1 alpha in zebrafish and 18s ribosomal RNA in fathead minnow, using the 2−ΔΔCT method. In the (±) antx-a treatments, ANOVA and Dunnett’s post hoc were used to analyze treatment level responses compared to the negative control (*p < 0.05; **p < 0.01; ***p < 0.001). T tests were used to identify potential caffeine influences compared to the negative control (^ p < 0.05; ^^ p < 0.01; ^^^ p < 0.001), error bars (± SD). Zebrafish included 4 replicates with 21–24 larvae used for each treatment level. Fathead minnows included 4 replicates with 13–15 larvae used for each treatment level |