
|
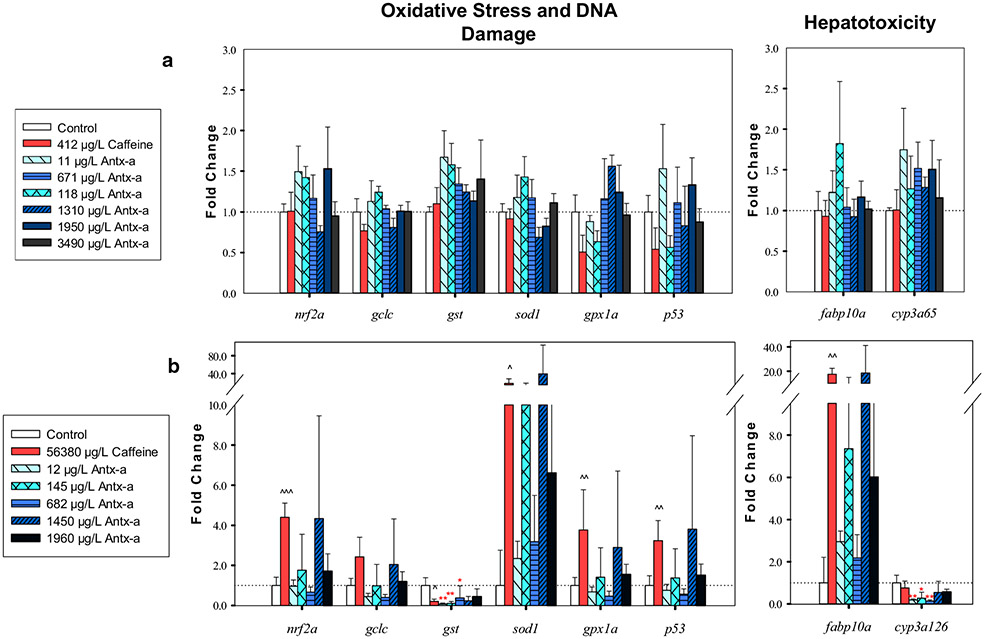
Fig. 6 RT-qPCR oxidative stress, DNA damage, and hepatotoxicity gene expression data comparing larval fathead minnows exposed for 96 h to (±) antx-a or caffeine compared to the negative control. For zebrafish (a) or fathead minnows (b) exposed for 96 h to (±) antx-a or caffeine compared to the negative control. Transcript levels were normalized to housekeeping gene, elongation factor 1 alpha in zebrafish and 18s ribosomal RNA in fathead minnow, using the 2−ΔΔCT method. In the (±) antx-a treatments, ANOVA and Dunnett’s post hoc were used to analyze treatment level responses compared to the negative control (*p < 0.05; **p < 0.01; ***p < 0.001). T tests were used to identify potential caffeine influences compared to the negative control (^ p < 0.05; ^^ p < 0.01; ^^^ p < 0.001), error bars (± SD). Zebrafish included 4 replicates with 21–24 larvae used for each treatment level. Fathead minnows included 4 replicates with 13–15 larvae used for each treatment level