
|
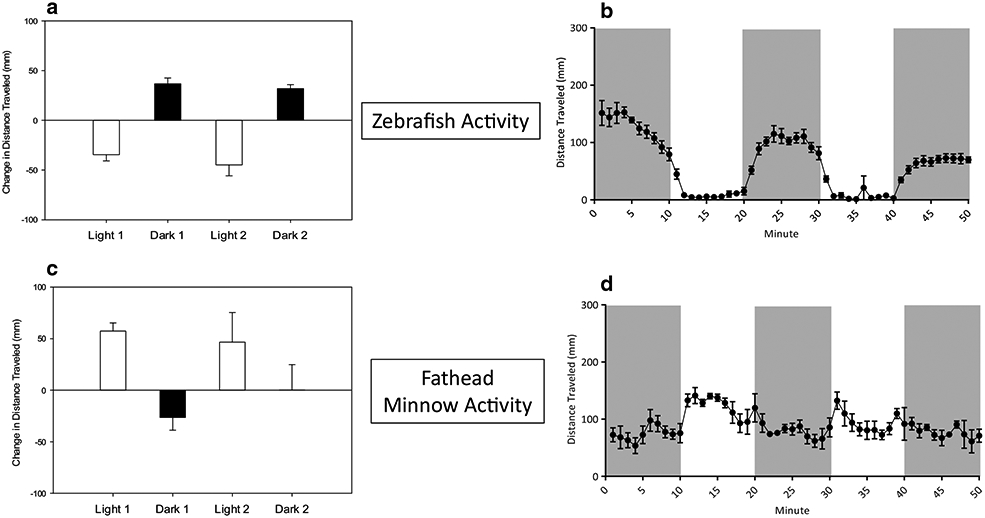
Fig. 1 Photomotor response and total locomotor behavior of unexposed zebrafish (a, b) and fathead minnows (c, d). a and c show photomotor response measured as the change in mean (± SE) total distance traveled between the last minute of the prior photoperiod and the first minute of the following period. b, d show mean (± SE) distance swam at each minute interval. Dark gray bars represent activity in the dark and the white bars represent activity in the light. A total of 24 zebrafish (4 replicates each with 6 larvae) and 12 fathead minnows (3 replicates with 4 larvae) were used for baseline behavioral observation