
|
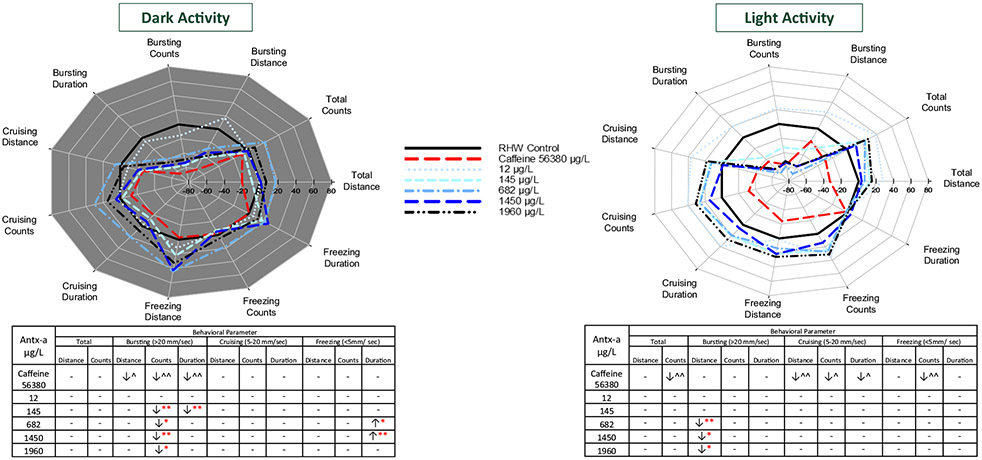
Fig. 4 Behavioral response profiles of mean fathead minnow swimming movement and speed in the dark (a) and in the light (b) each comprising 20 min (2 intervals of 10 min) after 96-h exposure to (±) anatoxin-a or caffeine. Behavioral parameters include swim distance, number of changes in movement (count), and swim duration in total and across 3 speeds, bursting (> 20 mm/s), cruising (5–20 mm/s), and freezing (< 5 mm/s). The tables below the graphs indicate a significant increase (↑) or decrease (↓) in activity compared to the negative control. In the (±) antx-a treatments, ANOVA and Dunnett’s post hoc were used to analyze treatment level responses compared to the negative control (*p < 0.10; ** p < 0.05; ***p < 0.01), T tests were used to identify potential caffeine influences compared to the negative control (^ p < 0.10; ^^ p < 0.05; ^^^ p < 0.01). A total 12 fathead minnows (3 replicates with 4 larvae) were used for each treatment level