
- Title
-
Loss of smarcad1a accelerates tumorigenesis of malignant peripheral nerve sheath tumors in zebrafish
- Authors
- Han, H., Jiang, G., Kumari, R., Silic, M.R., Owens, J.L., Hu, C.D., Mittal, S.K., Zhang, G.J.
- Source
- Full text @ Genes Chromosomes Cancer
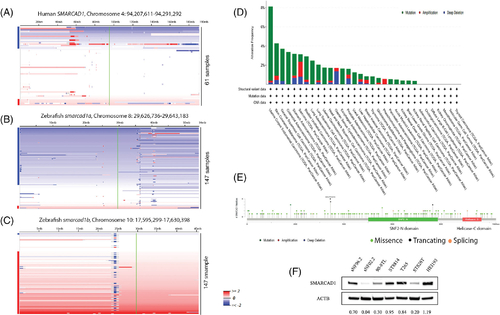
Frequent mutations of SMARCAD1 in humans and zebrafish suggest it is a tumor suppressor. (A) Heat map of human chromosome 4. SAMRCAD1 is located on this chromosome. The locus of SMARCAD1 (green line) was found to be underrepresented in ~26% (16 out of 61) human MPNSTs.8 (B) Zebrafish smarcad1a is located on chromosome 8, which is underrepresented in about 70% (103 out of 147) of zebrafish MPNSTs. (C) Zebrafish smarcad1b is located on chromosome 10, which is overrepresented in about 60% (88 out of 147) of zebrafish MPNSTs. Samples are sorted top-to-bottom by decreasing deletion amplitude at the respective SAMRCAD1/smarcad1 locus, indicated by a green line. Blue and red bars on the right side of each panel indicate samples with SAMRCAD1/smarcad1 losses (blue) or gains (red). Color densities are corresponding to the degree of loss and gain as previously described.8 (D) SMARCAD1 mutation frequency of human cancers in TCGA database. (E) SMARCAD1 mutation types and positions found in human cancers in TCGA database. (F) SMARCAD1 expression level of 6 human MPNST cell lines (all NF1 mutant except STS26T) and HEI-193, immortalized human schwannoma |

Zebrafish have two smarcad1 genes. (A) Extended majority-rule consensus tree for the Bayesian phylogenetic analysis of SMARCAD1 proteins. Numbers at each node indicate posterior probability (pp) values based on 20 million runs. Branch lengths are proportional to the means of the pp densities for their expected replacements per site. The ME and ML phylogenetic trees (Figures S1 and S2) were generally in agreement with the BP phylogeny: most of the metazoan species have one SMARCAD1 gene, while there are usually two smarcad1 genes in teleost genomes. The two smarcad1s most likely resulted from teleost-specific whole-genome duplications, as each formed a distinct clade. The tree was rooted with yeast. (B) Syntenic relationship between human and zebrafish chromosomes. Zebrafish chromosome 8 (Dre8) that contains smarcad1a and three other genes (FAM190A, GRID2, and ATOH1, bottom row) are orthologous to, and in the same order as, genes in the portion of human chromosome 4 (Hsa4) that contains SMARCAD1 (middle row). A portion of Dre10 contains smarcad1b, but not the other three directly linked genes. However, this part of Dre10 is co-orthologous to the portion of Hsa4 that contains SMARCAD1, as they share other syntenies (top row). Orthologous genes are indicated with colored lines |

The two smarcad1 zebrafish genes are expressed in both overlapped and distinct regions during embryonic development. Whole-mount in situ hybridization of zebrafish embryos at stages 12S (A, E), 20S (B, F), 24 hpf (C, D, G, H), 48 hpf (I–P), and 72 hpf (Q–X). Anterior is to the left in all whole-mount images, and dorsal is to the top in all transverse sections. Gene names are labeled at the upright corner in the panels of whole-mount images. (A–D, I–L, and Q–T): gene expression of smarcad1a. (E–H, M–P, and U–X): gene expression of smarcad1b. (A and C) Lateral view of the expression of smarcad1a at 12S, 20S, and 24dpf, respectively. (D) Transverse section through the trunk region of the embryos in panel C. smarcad1a is mainly expressed in the neural tissues, endoderm, and intermediate cell mass at these stages. (E and G) Lateral view of the expression of smarcad1b at 12S, 20S, and 24dpf, respectively. (H) Transverse section through the trunk region of the embryos in panel G. The expression patterns of smarcad1b are very similar to smarcad1a at these early stages. (I, J) Lateral and dorsal view of the expression of smarcad1a at 48 hpf. (K and L) Transverse section through the head and pectoral fin regions. (M and N) Lateral and dorsal view of the expression of smarcad1b at 48 hpf. (O and P) Transverse section through the head and pectoral fin regions. (Q and R) Lateral and dorsal view of the expression of smarcad1a at 72 hpf. (S and T) Transverse section through the head and pectoral fin regions. (U and V) Lateral and dorsal view of the expression of smarcad1b at 72 hpf. (W and X) Transverse section through the head and pectoral fin regions. The dashed lines indicate the positions of sections. The letters below the dashed lines correspond to the panels. de, diencephalon; dm, dermomyotome; end, endoderm; fb, forebrain; hb, hindbrain; icm, intermediate cell mass; ir, iris; le, lens; mand, mandibular cartilage; mb, middle brain; mhb, midbrain-hindbrain boundary; mz, ciliary marginal zone; n, notochord; nt, neural tube; op, optical cup; pf, pectoral fin; pa, pharyngeal; quad, quadrate cartilage; ret, retina; tb, tail bud EXPRESSION / LABELING:
|
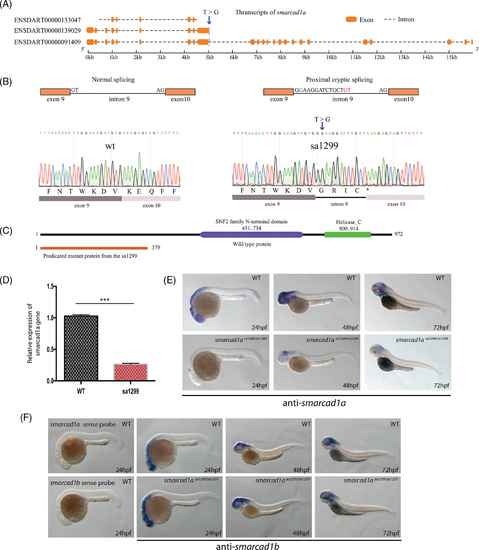
Sa1299 is an essential splicing mutant of the smarcad1a gene in zebrafish. (A) Schematic illustration of smarcad1a transcription and T to G single nucleotide mutation in the 5′ end essential spicing site of intron 9. The transcription information is based on the GRCz10 in Ensembl. (B) Normal and aberrant splicing are illustrated in the top row. Proximal cryptic splicing resulted in 13 bps from intron 9 retained in the mRNA. T > G mutation is highlighted blue, and cryptic GT is highlighted with red letters. This result was confirmed by Sanger sequencing (bottom row). (C) Predicted functional domains from full-length protein and truncated proteins (without the functional domains) resulted from premature stop codon (asterisk) due to the proximal cryptic splicing. Amino acid numbers are indicated in the diagram. (D) The mRNA level of ENSDART00000091409 is decreased by RT-PCR in 1dpf sa1299 homozygous embryos, most likely caused by nonsense-mediated mRNA decay. (E) Decrease of smarcad1a ENSDART00000091409 mRNA also is detected by whole-mount in situ hybridization in 1–3 dpf zebrafish embryos. (F) The smarcad1b gene is not affected and still expressed in similar expression domains with smarcad1a in sa1299 homozygotes. The sense probe controls are included in the first two vertical panels EXPRESSION / LABELING:
|
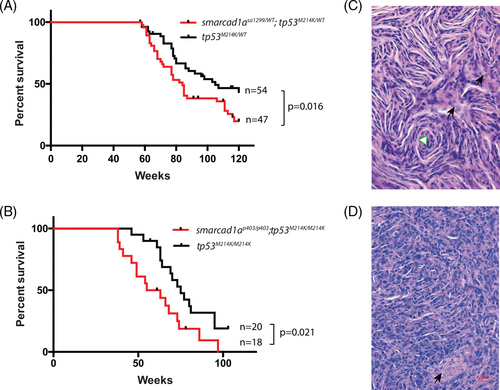
Smarcad1a was able to accelerate tumorigenesis in a zebrafish MPNST model initiated by loss-of-function tp53. (A) Kaplan–Meier survival curve showing tumor-free survival of cohorts of single (black line) and double heterozygotes (red line) derived from smarcad1asa1299/WT; tp53M124K/WT and tp53M124K/WT. Fish were genotyped by PCR for each relevant mutation at 6–8 weeks of age and housed segregated by genotype. The numbers of fish of each genotype and the p values between the tp53 single heterozygote and the double mutants are shown in the figure. (B) Kaplan–Meier curve showing tumor-free survival of cohorts of single (black line) and double heterozygotes (red line) derived from smarcad1ap403/p403; tp53M124K/M124K and tp53M124K/M124K. (C) Typical histology of zebrafish MPNST by hematoxylin–eosin staining: spindle cells and swirling structure (white triangle). (D) Heterogonous regions without typical spindle cells from the same tumor. Black arrows indicate necrosis PHENOTYPE:
|
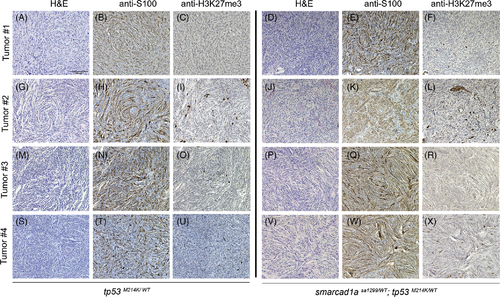
Confirmation of zebrafish MPNSTs with S100 and H3K27me3. Four random tumors from tp53 heterozygotes and double heterozygotes (tp53 and sa1299) were stained with S100 and H3K27me3 antibodies. (A–C, G–I, M–O, S–U): tp53 heterozygotes. (D–F, J–L, P–R, V–X): double heterozygotes. HE (hematoxylin and eosin) staining: A, D, G, J, M, P, S, V. IHC with S100 antibody: B, E, H, K, N, Q, T, W. IHC with H3K27me antibody staining: C, F, I, L, O, R, U, X. Some stained cells are non-Schwann cells in these sections, but they serve as a positive control for the antibody specificity. All the images were taken at the same magnification. Scale bar = 100 μm in panel A |

Zebrafish smarcad1a mutant created by CRISPR. (A) Transcripts of the smarcad1a gene, according to Ensembl (GRCz11). (B) Diagram of consequences of the p403 mutant on the SMARCAD1A protein. The top is the intact protein, and the bottom is the truncated protein. Protein domains were predicted by SMART domain. (C) Sequencing result of the smarcad1a p403 allele compared with wildtype (WT). The PAMs were highlighted in cyan, and the positions of CRISPR gRNAs are underneath the PAM sequences. The yellow highlighted nucleotides are the insertion. There is a 329 bps deletion from position 114 to 382 in the diagram. The tildes (~) represent deleted sequences. Asterisk (*) and hashtag (#) indicate the gRNA CR383 and CR490, respectively |
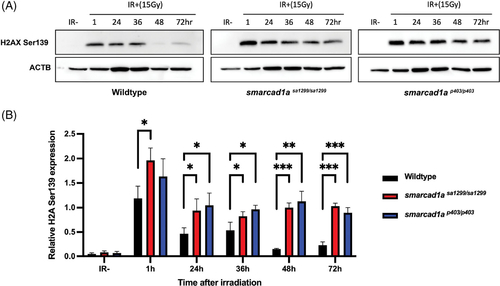
DNA damage response is compromised in zebrafish embryos. (A) Representative western blot showing protein expression or phosphorylation of H2AX ser139 upon the indicated treatment in wildtype, smarcad1asa1299−/−, and smarcad1ap403−/− 1dpf zebrafish embryos. For irradiated samples (IR+), samples were harvested at the indicated hour post 15 Gy IR. (B) Quantification of protein expression via western blotting from panel A. For each biological replicate, values were normalized to the value for “IR−” to calculate the fold change in phosphorylation of H2AX upon the indicated treatment. Bars in (B) are the mean of three independent experiments. Statistical analysis comparing experimental to the control (“IR−”) was performed using Welch’s t test (*p ≤ 0.05; **p ≤ 0.01; ***p ≤ 0.001; ****p ≤ 0.0001; NS p > 0.05) |
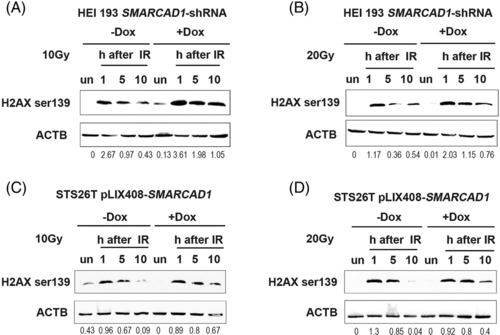
Human cells show a defect in double-strand DNA damage repair. (A, B) Double-strand DNA damage repair was measured by Western blots with anti-histone H2AX S139ph (phospho Ser139) in SMARCAD1 knockdown schwannoma cell line HEI-193 after X-ray irradiations (10 and 20 Gy, respectively). ULTRA-3351712 knockdown cell was used for this experiment. Doxycycline (final concentration: 0.1 μg/ml) was added 48 h ahead of the experiments. (C, D) Double-strand DNA damage repair in SMARCAD1 overexpression MPNST cells (STS26T) by H2AX S139ph. Doxycycline (final concentration: 1 μg/ml) was added 24 h ahead of the experiments. Both cell lines were harvested at 1, 5, and 10 h post-irradiation along with untreated samples. un, untreated sample. Beta-actin (ACTB) was used as a loading control. The densitometry ratios of H2A X S139ph over ACTB was listed underneath the blots |

Cell proliferation and independent growth were inhibited in both SMARCAD1 knockdown and overexpression. Proliferation was measured by MTT assay in SMARCAD1 knockdown HEI193 cells (A) and overexpression STS26T cells (B). Growth differences were evident from day 3 in both cases. Anchorage-independent growth was examined by soft-agar assay in SMARCAD1 knockdown HEI193 cells (C) and overexpression STS26T cells (D). All the assays were done with three biological replicates. Asterisk (*) indicates statistical significance, p < 0.05 |
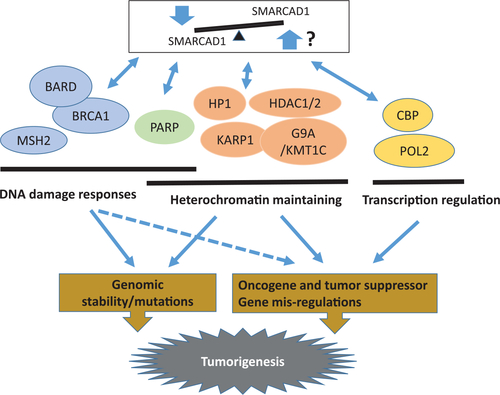
Model of SMARCAD1 tumor suppressor mechanisms. Three mechanisms (DNA damage response, heterochromatin maintaining, and transcription regulation) were proposed based on current knowledge.33,34,36,38,72,73,80,81 The bidirectional arrows indicate protein–protein interactions. The arrows imply cellular consequences. The dashed arrows show a possible result. The involved genes and pathways are solely based on loss-of-function studies due to the lack of overexpression reports |