
Fig. 5
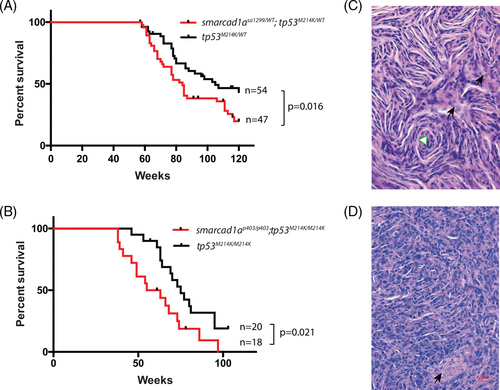
Smarcad1a was able to accelerate tumorigenesis in a zebrafish MPNST model initiated by loss-of-function tp53. (A) Kaplan–Meier survival curve showing tumor-free survival of cohorts of single (black line) and double heterozygotes (red line) derived from smarcad1asa1299/WT; tp53M124K/WT and tp53M124K/WT. Fish were genotyped by PCR for each relevant mutation at 6–8 weeks of age and housed segregated by genotype. The numbers of fish of each genotype and the p values between the tp53 single heterozygote and the double mutants are shown in the figure. (B) Kaplan–Meier curve showing tumor-free survival of cohorts of single (black line) and double heterozygotes (red line) derived from smarcad1ap403/p403; tp53M124K/M124K and tp53M124K/M124K. (C) Typical histology of zebrafish MPNST by hematoxylin–eosin staining: spindle cells and swirling structure (white triangle). (D) Heterogonous regions without typical spindle cells from the same tumor. Black arrows indicate necrosis |
| Fish: | |
|---|---|
| Observed In: | |
| Stage: | Adult |