
IMAGE
Fig. 10
- ID
- ZDB-IMAGE-221030-80
- Publication
- Han et al., 2021 - Loss of smarcad1a accelerates tumorigenesis of malignant peripheral nerve sheath tumors in zebrafish
- All Figures
- Figures for Han et al., 2021
Image
|
Figure Caption
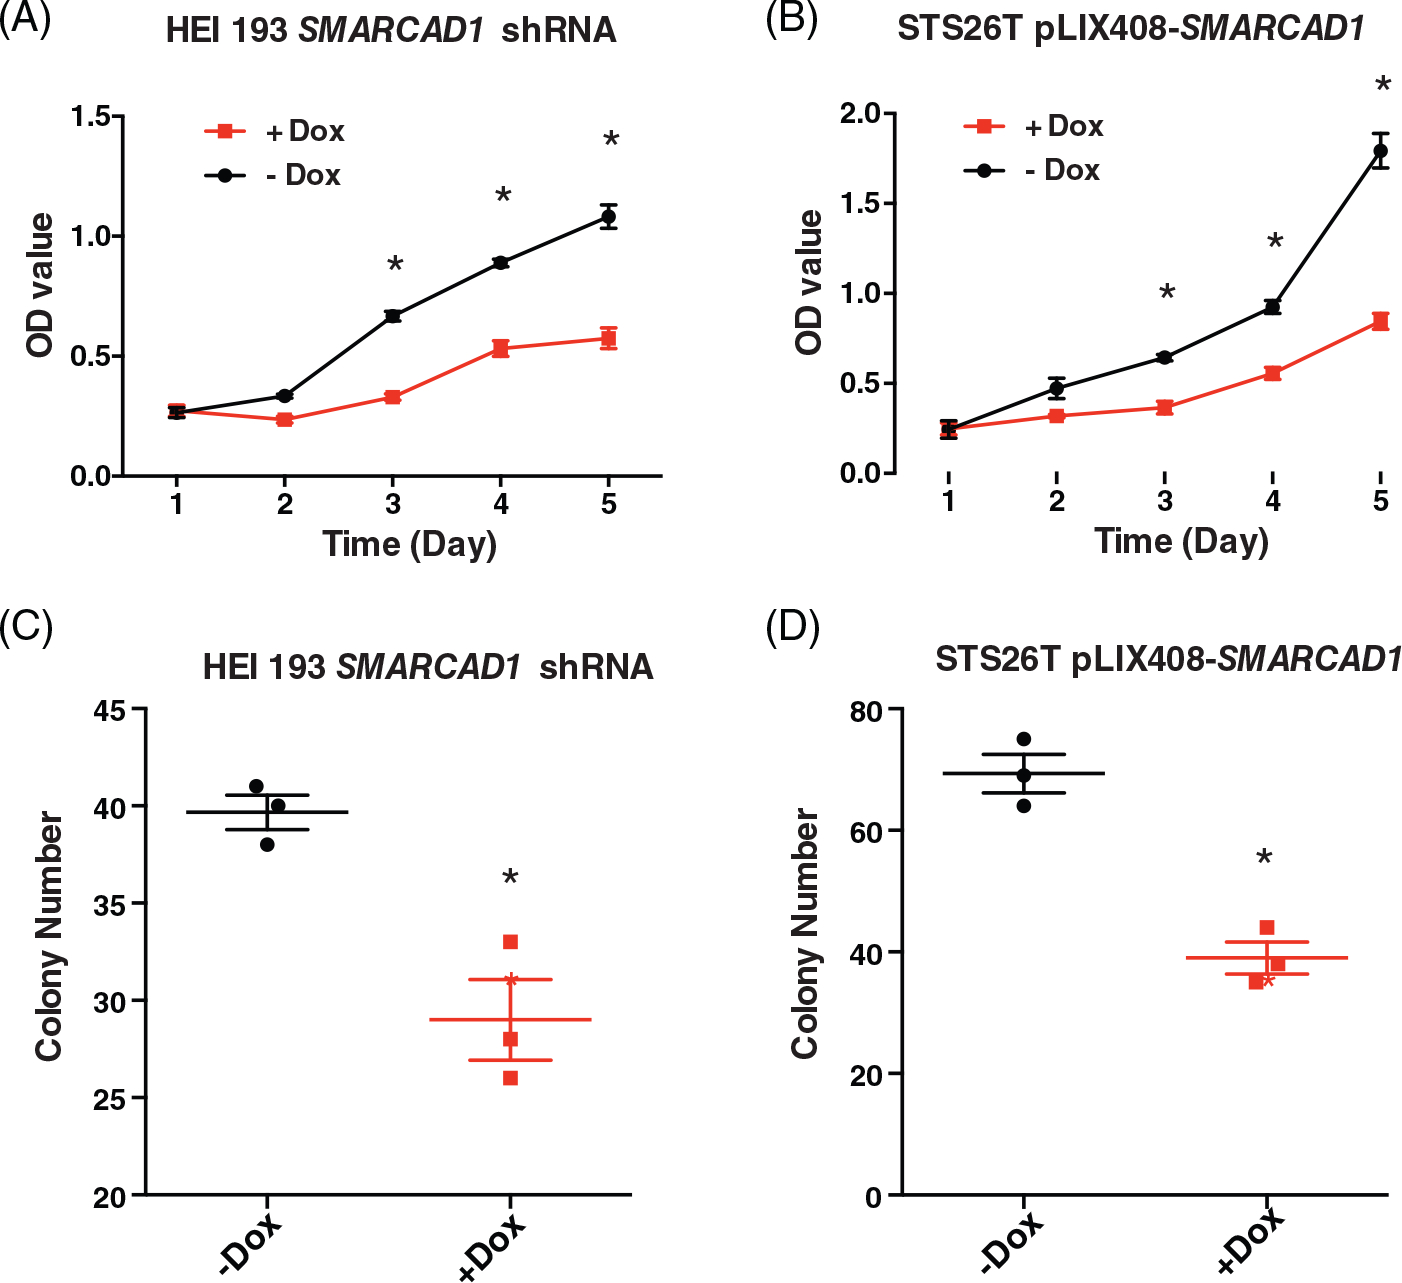
Fig. 10
Cell proliferation and independent growth were inhibited in both SMARCAD1 knockdown and overexpression. Proliferation was measured by MTT assay in SMARCAD1 knockdown HEI193 cells (A) and overexpression STS26T cells (B). Growth differences were evident from day 3 in both cases. Anchorage-independent growth was examined by soft-agar assay in SMARCAD1 knockdown HEI193 cells (C) and overexpression STS26T cells (D). All the assays were done with three biological replicates. Asterisk (*) indicates statistical significance, p < 0.05
Acknowledgments
This image is the copyrighted work of the attributed author or publisher, and
ZFIN has permission only to display this image to its users.
Additional permissions should be obtained from the applicable author or publisher of the image.
Full text @ Genes Chromosomes Cancer