FIGURE SUMMARY
Title

A stochastic oscillator model simulates the entrainment of vertebrate cellular clocks by light

Authors
Kumpošt, V., Vallone, D., Gondi, S.B., Foulkes, N.S., Mikut, R., Hilbert, L.
Source
Full text @ Sci. Rep.

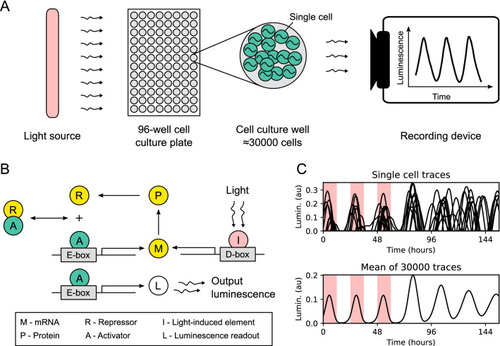
Experiment setup and simulation of core circadian clock dynamics in zebrafish cell cultures. (
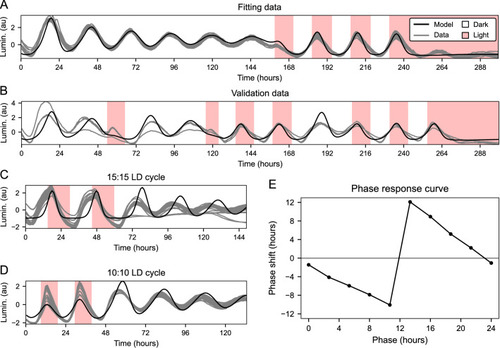
A) 96-well culture plates were placed in a dark room and illuminated with a time-controlled light source. Each well contains approximately 30,000 cells transfected with a bioluminescent reporter of zper1b transcription. The output luminescence from each well is recorded as a separate time trace. (B) Schematic of the mathematical model of the zebrafish core circadian clock. The activator (green) binds to the E-box enhancer in the promoter of a clock gene and activates the production of the repressor (yellow). After transcription, translation, and translocation back to the nucleus, the repressor binds to the activator, thus preventing E-box-driven transcriptional activation. External light stimuli take effect through the activation of a light-driven gene with the D-box enhancer. The luminescence output is assumed to be proportional to the E-box activation. (C) Simulated luminescence traces are obtained by averaging 30,000 independent evaluations of the model. The output luminescence after normalization is presented in arbitrary units (au). Red shading indicates periods when the light source was turned on.

Simulation of zper1b:luc expression dynamics under various lighting conditions. (A) On this plate, cell cultures were exposed to 6 days of constant darkness, three 12:12 LD cycles, and 3 days of constant light. This recording was used to estimate the model parameters. (B) On this plate, cell cultures were exposed to a combination of LD cycles, constant darkness, and constant light. The same parameters as in (A) were used to run the model, showing that the model can also reproduce dynamics of data not used for parameter fitting. (C) This plate was exposed to 15:15 LD cycles. Parameters estimated from (A) were used without further fitting. (D) This plate was exposed to 10:10 LD cycles. Parameters estimated from (A) were used without further fitting. (E) Simulated phase response curve to 12-h light pulses.

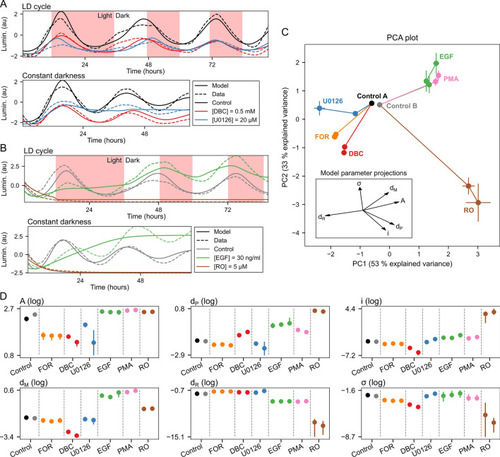
Characterization of compound effects by refitting of model parameters. (A) Representative experimental data traces and model fits for plate set A. Plate set A contained treatments with dimethyl sulfoxide (DMSO) control, forskolin (FOR), dibutyryl cAMP (DBC), and U0126. See Supplementary Fig. S4A–C for model fits for all concentrations of FOR, DBC, and U0126. (B) Representative experimental data traces and model fits for plate set B. Plate set B contained treatments with DMSO control, epidermal growth factor (EGF), phorbol-12-myristate-13-acetate (PMA), and ro-318220 (RO). See Supplementary Fig. S4D–F for model fits for all concentrations of EGF, PMA, and RO. (C) The principal component plot depicts the projection of the compound-dependent changes in model parameters on two main principal components (PCs), which provides a tool to visualize the changes of the model parameters in a two-dimensional plot. Each compound and concentration is represented with a point. The error bars at each point indicate the spread of the final population of parameter sets obtained by a differential evolution algorithm (median ± median absolute deviation). Individual values used to calculate the median points are shown in Supplementary Fig. S3. Lines connect increasing concentrations of the same compound, starting from the control condition. Control A is a DMSO control for FOR, DBC, and U0126. Control B is a DMSO control for PMA, EGF, and RO. The explained variance for the first three PCs was 53%, 33%, and 8%. (D) Parameter values for all pharmacological treatments. Each dot indicates median value and lines maximal and minimal values of the parameter sets obtained by a differential evolution algorithm. Multiple dots per compound indicate increasing concentrations of the same compound from left to right.

Acknowledgments
This image is the copyrighted work of the attributed author or publisher, and ZFIN has permission only to display this image to its users. Additional permissions should be obtained from the applicable author or publisher of the image. Full text @ Sci. Rep.