
Figure 2
- ID
- ZDB-IMAGE-210719-9
- Publication
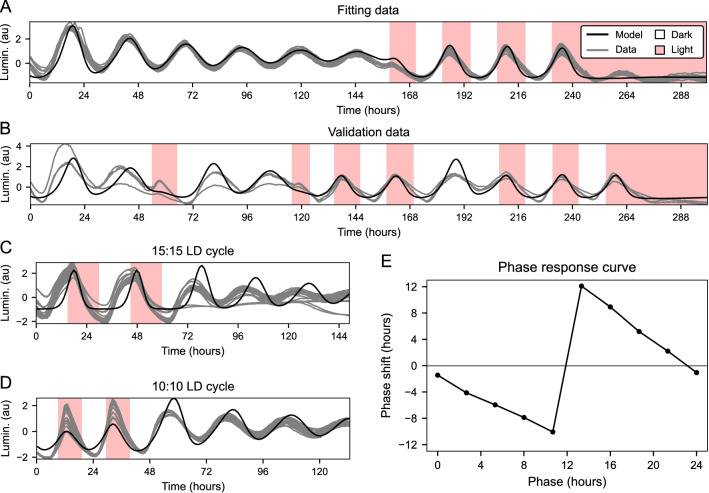
- Kumpošt et al., 2021 - A stochastic oscillator model simulates the entrainment of vertebrate cellular clocks by light
- All Figures
- Figures for Kumpošt et al., 2021
|
Figure 2
Simulation of