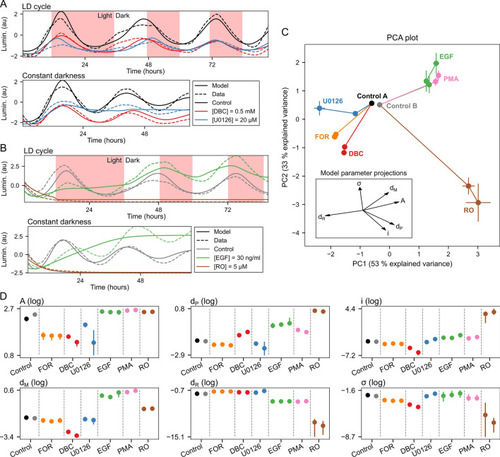
Characterization of compound effects by refitting of model parameters. (A) Representative experimental data traces and model fits for plate set A. Plate set A contained treatments with dimethyl sulfoxide (DMSO) control, forskolin (FOR), dibutyryl cAMP (DBC), and U0126. See Supplementary Fig. S4A–C for model fits for all concentrations of FOR, DBC, and U0126. (B) Representative experimental data traces and model fits for plate set B. Plate set B contained treatments with DMSO control, epidermal growth factor (EGF), phorbol-12-myristate-13-acetate (PMA), and ro-318220 (RO). See Supplementary Fig. S4D–F for model fits for all concentrations of EGF, PMA, and RO. (C) The principal component plot depicts the projection of the compound-dependent changes in model parameters on two main principal components (PCs), which provides a tool to visualize the changes of the model parameters in a two-dimensional plot. Each compound and concentration is represented with a point. The error bars at each point indicate the spread of the final population of parameter sets obtained by a differential evolution algorithm (median ± median absolute deviation). Individual values used to calculate the median points are shown in Supplementary Fig. S3. Lines connect increasing concentrations of the same compound, starting from the control condition. Control A is a DMSO control for FOR, DBC, and U0126. Control B is a DMSO control for PMA, EGF, and RO. The explained variance for the first three PCs was 53%, 33%, and 8%. (D) Parameter values for all pharmacological treatments. Each dot indicates median value and lines maximal and minimal values of the parameter sets obtained by a differential evolution algorithm. Multiple dots per compound indicate increasing concentrations of the same compound from left to right.
|

