IMAGE

Figure 1

ID
ZDB-IMAGE-210719-8
Source
Figures for Kumpošt et al., 2021
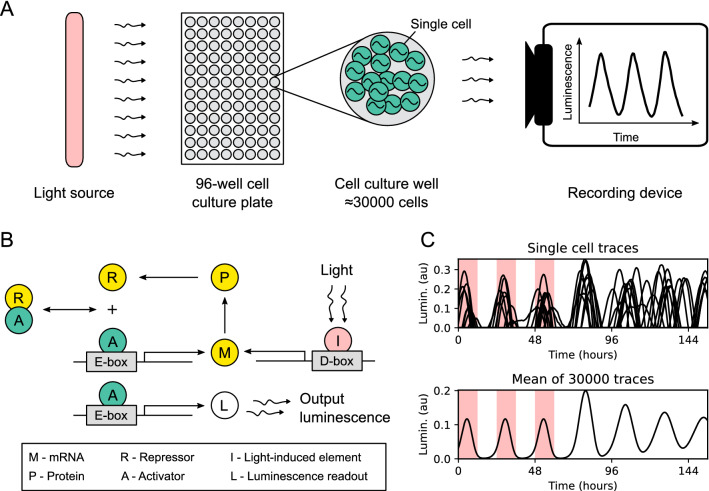
Image
Figure Caption

Figure 1

Experiment setup and simulation of core circadian clock dynamics in zebrafish cell cultures. (A) 96-well culture plates were placed in a dark room and illuminated with a time-controlled light source. Each well contains approximately 30,000 cells transfected with a bioluminescent reporter of zper1b transcription. The output luminescence from each well is recorded as a separate time trace. (B) Schematic of the mathematical model of the zebrafish core circadian clock. The activator (green) binds to the E-box enhancer in the promoter of a clock gene and activates the production of the repressor (yellow). After transcription, translation, and translocation back to the nucleus, the repressor binds to the activator, thus preventing E-box-driven transcriptional activation. External light stimuli take effect through the activation of a light-driven gene with the D-box enhancer. The luminescence output is assumed to be proportional to the E-box activation. (C) Simulated luminescence traces are obtained by averaging 30,000 independent evaluations of the model. The output luminescence after normalization is presented in arbitrary units (au). Red shading indicates periods when the light source was turned on.

Acknowledgments
This image is the copyrighted work of the attributed author or publisher, and ZFIN has permission only to display this image to its users. Additional permissions should be obtained from the applicable author or publisher of the image. Full text @ Sci. Rep.