FIGURE SUMMARY
Title

Automatic Segmentation and Cardiac Mechanics Analysis of Evolving Zebrafish Using Deep Learning

Authors
Zhang, B., Pas, K.E., Ijaseun, T., Cao, H., Fei, P., Lee, J.
Source
Full text @ Front Cardiovasc Med

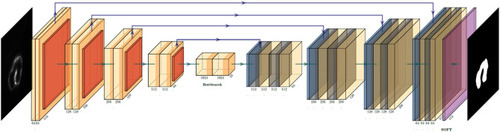
U-net convolution neural network (CNN) architecture utilized to generate the binary mask of the intracardiac domain of zebrafish. Each box represents a multichannel feature map that allows for efficient and accurate extraction of anatomical features. In our specific application, the input was a 512 × 512 pixel map.

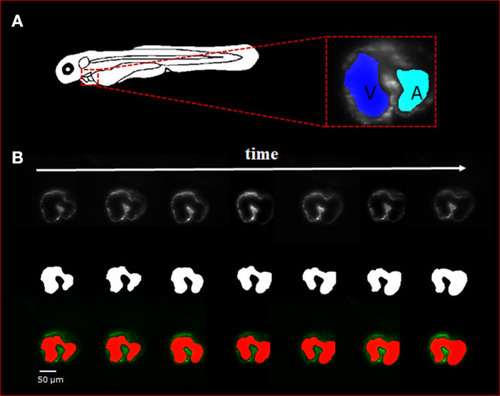
Sequence of selected light-sheet fluorescent microscopy (LSFM) images with the manual hand segmentation mask from 4 dpf zebrafish heart. (A) Diagram showing the anatomical feature of the zebrafish heart as well as a single axial slice with corresponding binary mask generated by the U-net. It is observed that there is a clear distinction between the atria and ventricle of the specimen. (B) A sequence of selected axial slices with corresponding binary masks generated by our U-net program; the reference scale bar is 50 μm.

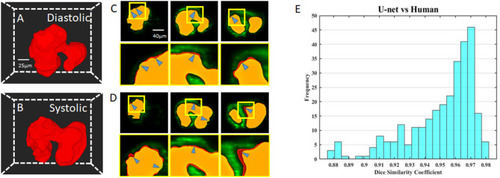
Comparison of U-net based autosegmentation to manual hand segmentation. (A,B) Geometric representation of both the diastolic and systolic stages of the heart cycle. (C,D) Comparison in the 2D axial plane between autosegmentation of the U-net and ground truth in both the diastolic and systolic stages, respectively. The blue arrows indicate areas of disjoint space within the segmentations, shown in red (manual segmentation), green (autosegmentation), and yellow (intersection). (E) Corresponding Dice similarity coefficient comparing the results between our ground truth and automatic segmentation demonstrated the ability of autosegmentation.

Subdivision of atrium and ventricle. (A) Methodology of using the automatic segmentation to define the morphology of inner volume of the zebrafish heart. This method relies on an iterative process that uses an erosion operator on the 3D structure of the inner volume until division occurs. Following the division of the volume into two separate components, extraction of each individual piece follows with a dilation operation and intersection with the original volume. (B) 2D axial slices showing the differentiation of the atrium (teal) and ventricle (blue) of various slices. (C) Area change over time from 2D slice (B) was successfully demonstrated.

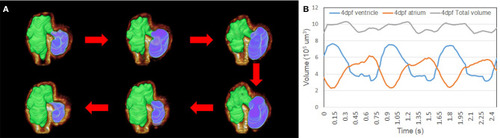
Representation of the contraction to dilation of zebrafish heart volume change over time. (A) Autosegmented successfully reconstructed 4D image captured the rough inner surface of zebrafish due to trabeculation after merging with fluorescent-labeled tg(cmlc2:gfp) zebrafish from light-sheet fluorescent microscopy (LSFM) images. (B) Volume change in the ventricle and atrium was measured from autosegmentation. Total volume of atrium and ventricle represented around 9.5 × 105 μm3 when zebrafish was at 4 dpf.

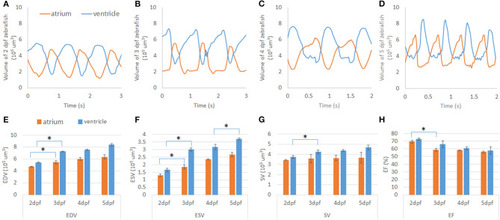
Cardiac mechanics analysis of developing zebrafish heart. (A–D) Volume change of developing zebrafish heart was measured by U-net-based autosegmentation, showing consistent increase in volume in both the atrium and ventricle. (E,F) After notable morphology change after cardiac looping, end-diastolic volume (EDV) and end-systolic volume (ESV) were increased significantly in both the atrium and ventricle. At 5 dpf, ESV was also significantly increased compared to 4 dpf. (G) While SV of the ventricle showed an increasing trend, that if the atrium remained at a similar level from 2 to 5 dpf. (H) Ejection fraction (EF) analysis demonstrated a decreasing trend from high EF at 2 dpf. *p ≤ 0.05.

Acknowledgments
This image is the copyrighted work of the attributed author or publisher, and ZFIN has permission only to display this image to its users. Additional permissions should be obtained from the applicable author or publisher of the image. Full text @ Front Cardiovasc Med