
FIGURE
Figure 5
- ID
- ZDB-FIG-210630-28
- Publication
- Zhang et al., 2021 - Automatic Segmentation and Cardiac Mechanics Analysis of Evolving Zebrafish Using Deep Learning
- Other Figures
- All Figure Page
- Back to All Figure Page
Figure 5
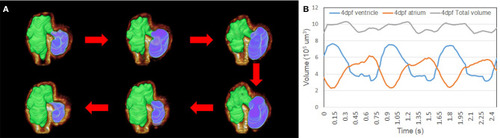
Representation of the contraction to dilation of zebrafish heart volume change over time. |
Expression Data
Expression Detail
Antibody Labeling
Phenotype Data
Phenotype Detail
Acknowledgments
This image is the copyrighted work of the attributed author or publisher, and
ZFIN has permission only to display this image to its users.
Additional permissions should be obtained from the applicable author or publisher of the image.
Full text @ Front Cardiovasc Med