FIGURE

Figure 3

ID
ZDB-FIG-210630-26
Publication
Zhang et al., 2021 - Automatic Segmentation and Cardiac Mechanics Analysis of Evolving Zebrafish Using Deep Learning
Other Figures
All Figure Page
Back to All Figure Page
Figure 3

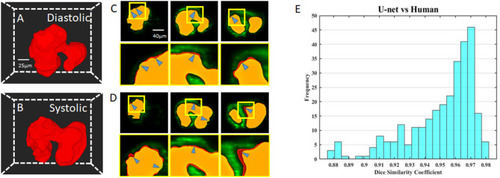
Comparison of U-net based autosegmentation to manual hand segmentation. (A,B) Geometric representation of both the diastolic and systolic stages of the heart cycle. (C,D) Comparison in the 2D axial plane between autosegmentation of the U-net and ground truth in both the diastolic and systolic stages, respectively. The blue arrows indicate areas of disjoint space within the segmentations, shown in red (manual segmentation), green (autosegmentation), and yellow (intersection). (E) Corresponding Dice similarity coefficient comparing the results between our ground truth and automatic segmentation demonstrated the ability of autosegmentation.

Expression Data

Expression Detail
Antibody Labeling
Phenotype Data

Phenotype Detail
Acknowledgments
This image is the copyrighted work of the attributed author or publisher, and ZFIN has permission only to display this image to its users. Additional permissions should be obtained from the applicable author or publisher of the image. Full text @ Front Cardiovasc Med