
- Title
-
A Screening of the MMV Pandemic Response Box Reveals Epetraborole as a New Potent Inhibitor against Mycobacterium abscessus
- Authors
- Kim, T., Hanh, B.T., Heo, B., Quang, N., Park, Y., Shin, J., Jeon, S., Park, J.W., Samby, K., Jang, J.
- Source
- Full text @ Int. J. Mol. Sci.
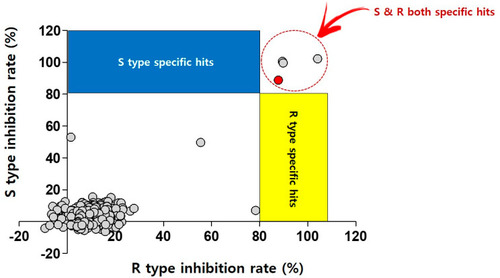
Dual screening of the Pandemic Response Box using Mab S and R variants. Scatter plot distribution showing the results of the Mab S and R variant dual screening of the Pandemic Response Box using resazurin reduction assay. A total of 400 compounds from the Pandemic Response Box were screened at 20 ?M against both Mab S and R variants. Growth inhibition of at least 80% was defined as the cut-off which resulted in 3 hits (0.75% hit rate). Red closed circle indicates CLA as positive control. |
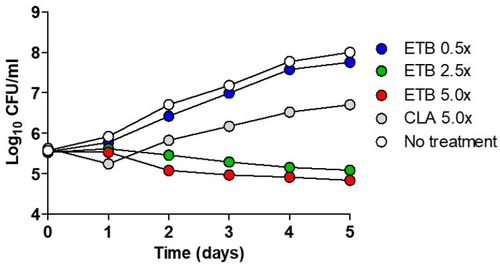
Time?kill curves of ETB against Mab. The bacteria were grown in a liquid culture (Middlebrook 7H9 medium) in the presence of the indicated concentrations of ETB and was plated on a 7H10 Middlebrook agar plate. Antibiotic concentrations are indicated by different symbols. Each point represents the mean of triplicate determinations. |

Intracellular activity of ETB against MabS-mWasabi. (A) Images of MabS-mWasabi infected mBMDMs on day 3 after treatment with different doses of ETB and TGC. DMSO was used as negative control. After 3 days of incubation with antibiotics, mBMDMs were stained with syto60 (red), and the cells were analyzed using the automated cell imaging system. The yellow colors represent MabS-mWasabi that were phagocytized by red-stained mBMDM cells. The pixel intensities of live MabS-mWasabi (blue closed circle) and cell number (red closed circle) were quantified after treatment with ETB (B) using CellReporterXpress� Image Acquisition and Analysis Software. |

Intracellular activity of ETB against MabS-mWasabi. (A) Images of MabS-mWasabi infected mBMDMs on day 3 after treatment with different doses of ETB and TGC. DMSO was used as negative control. After 3 days of incubation with antibiotics, mBMDMs were stained with syto60 (red), and the cells were analyzed using the automated cell imaging system. The yellow colors represent MabS-mWasabi that were phagocytized by red-stained mBMDM cells. The pixel intensities of live MabS-mWasabi (blue closed circle) and cell number (red closed circle) were quantified after treatment with ETB (B) using CellReporterXpress� Image Acquisition and Analysis Software. |
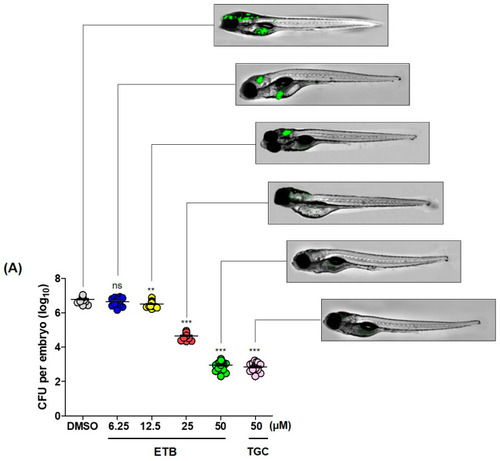
ZF In vivo efficacy of ETB. (A) Different concentrations of ETB (6.25, 12.5, 25, and 50 �M) and TGC (50 �M) were treated to the ZF infected with MabR-mWasabi and proliferation or reduction of mWasabi signal in ZF was monitored under the fluorescent microscope. After antibiotics treatment, the bacterial burden of infected ZF was quantified through traditional agar plate quantification method. Data was expressed as the mean log10 CFU per embryo (n = 10 of each condition) from three independent experiments. (B) All infected fishes treated at 6.25, 12.5, 25, and 50 �M of ETB and TGC (50 �M). Survival curve was plotted from MabR-mWasabi infected ZF for 13 days. (n = 20, representative of three independent experiments). Survival curves were compared with the log-rank (Mantel-Cox) test (* p < 0.05, ** p < 0.01; *** p < 0.001; ns: Not significant). Inf UNT: Infected but not treated control. PHENOTYPE:
|
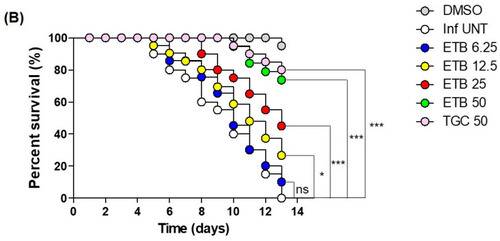
ZF In vivo efficacy of ETB. (A) Different concentrations of ETB (6.25, 12.5, 25, and 50 �M) and TGC (50 �M) were treated to the ZF infected with MabR-mWasabi and proliferation or reduction of mWasabi signal in ZF was monitored under the fluorescent microscope. After antibiotics treatment, the bacterial burden of infected ZF was quantified through traditional agar plate quantification method. Data was expressed as the mean log10 CFU per embryo (n = 10 of each condition) from three independent experiments. (B) All infected fishes treated at 6.25, 12.5, 25, and 50 �M of ETB and TGC (50 �M). Survival curve was plotted from MabR-mWasabi infected ZF for 13 days. (n = 20, representative of three independent experiments). Survival curves were compared with the log-rank (Mantel-Cox) test (* p < 0.05, ** p < 0.01; *** p < 0.001; ns: Not significant). Inf UNT: Infected but not treated control. |