
|
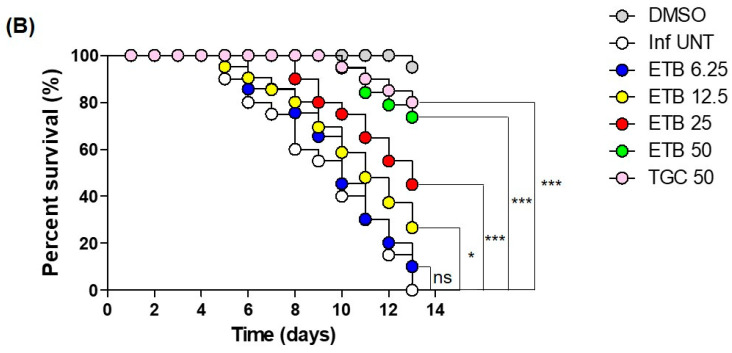
Figure 4 cont. ZF In vivo efficacy of ETB. (A) Different concentrations of ETB (6.25, 12.5, 25, and 50 µM) and TGC (50 µM) were treated to the ZF infected with MabR-mWasabi and proliferation or reduction of mWasabi signal in ZF was monitored under the fluorescent microscope. After antibiotics treatment, the bacterial burden of infected ZF was quantified through traditional agar plate quantification method. Data was expressed as the mean log10 CFU per embryo (n = 10 of each condition) from three independent experiments. (B) All infected fishes treated at 6.25, 12.5, 25, and 50 µM of ETB and TGC (50 µM). Survival curve was plotted from MabR-mWasabi infected ZF for 13 days. (n = 20, representative of three independent experiments). Survival curves were compared with the log-rank (Mantel-Cox) test (* p < 0.05, ** p < 0.01; *** p < 0.001; ns: Not significant). Inf UNT: Infected but not treated control.