
|
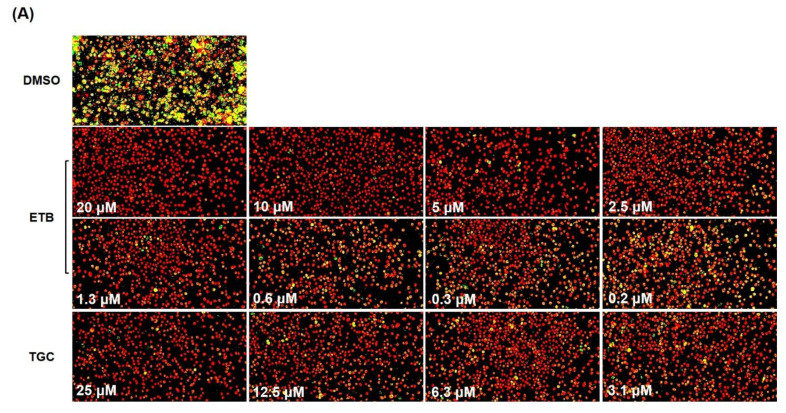
Figure 3 Intracellular activity of ETB against MabS-mWasabi. (A) Images of MabS-mWasabi infected mBMDMs on day 3 after treatment with different doses of ETB and TGC. DMSO was used as negative control. After 3 days of incubation with antibiotics, mBMDMs were stained with syto60 (red), and the cells were analyzed using the automated cell imaging system. The yellow colors represent MabS-mWasabi that were phagocytized by red-stained mBMDM cells. The pixel intensities of live MabS-mWasabi (blue closed circle) and cell number (red closed circle) were quantified after treatment with ETB (B) using CellReporterXpress® Image Acquisition and Analysis Software.