
Image
|
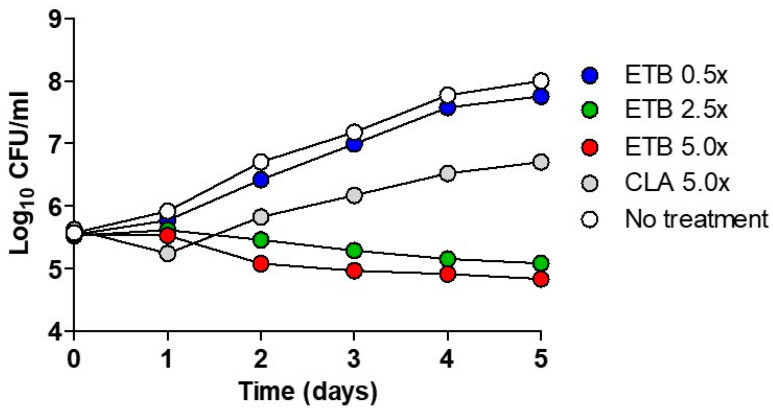
Figure Caption
Figure 2 Time–kill curves of ETB against Mab. The bacteria were grown in a liquid culture (Middlebrook 7H9 medium) in the presence of the indicated concentrations of ETB and was plated on a 7H10 Middlebrook agar plate. Antibiotic concentrations are indicated by different symbols. Each point represents the mean of triplicate determinations.
Acknowledgments
This image is the copyrighted work of the attributed author or publisher, and
ZFIN has permission only to display this image to its users.
Additional permissions should be obtained from the applicable author or publisher of the image.
Full text @ Int. J. Mol. Sci.