
- Title
-
UBA2 variants underlie a recognizable syndrome with variable aplasia cutis congenita and ectrodactyly
- Authors
- Schnur, R.E., Yousaf, S., Liu, J., Chung, W.K., Rhodes, L., Marble, M., Zambrano, R.M., Sobreira, N., Jayakar, P., Pierpont, M.E., Schultz, M.J., Pichurin, P.N., Olson, R.J., Graham, G.E., Osmond, M., Contreras-García, G.A., Campo-Neira, K.A., Peñaloza-Mantilla, C.A., Flage, M., Kuppa, S., Navarro, K., Sacoto, M.J.G., Wentzensen, I.M., Scarano, M.I., Juusola, J., Prada, C.E., Hufnagel, R.B.
- Source
- Full text @ Genet. Med.

ZFIN is incorporating published figure images and captions as part of an ongoing project. Figures from some publications have not yet been curated, or are not available for display because of copyright restrictions. EXPRESSION / LABELING:
|
|
ZFIN is incorporating published figure images and captions as part of an ongoing project. Figures from some publications have not yet been curated, or are not available for display because of copyright restrictions. |
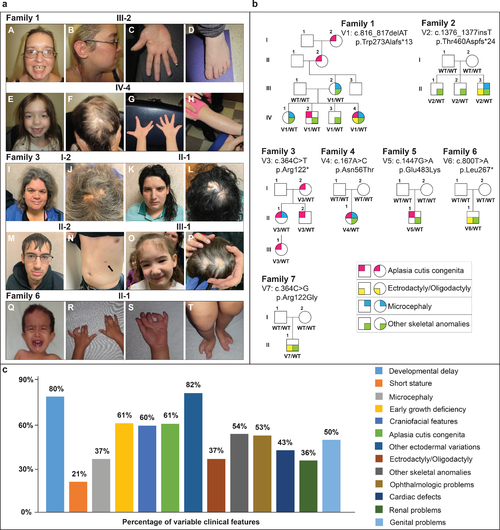
Fig. 1. Clinical phenotypes and pedigrees associated with UBA2-related syndrome. (a) Family 1, III-2: A. prominent forehead, high hairline, discolored peg-shaped teeth with gap between upper incisors, cleft chin. B. Low-set ear with simple cartilaginous pattern. C. diminished distal flexion creases. D. Brachydactyly, mild 2–3 syndactyly, clinodactyly of the 4th toe. Family 1, IV-4: E. Prominent forehead, high hairline, cleft chin, mildly downslanted palpebral fissures. F. Aplasia cutis congenita (ACC). G. Repaired ectrodactyly, hypoplastic distal flexion creases. H. Ichthyosis. Family 3, I-1: I. tall forehead, hypertelorism, broad nasal root, mild micrognathia. J. ACC. Family 3, II-1: K. Tall forehead, hypertelorism, broad nasal root, thin upper lip, medial eyebrow flare. L. ACC. Family 3, II-2: M. Facial features. N. Supernumerary nipple (arrow). Family 3, III-1: O. Tall forehead, low-set ears, micrognathia. P. ACC. Family 6, II-1: Q. High forehead, hypertelorism, bilateral epicanthal folds. R, S. bilateral 2–3 finger syndactyly, camptodactyly T. bilateral ectrodactyly of the feet. (b) Affected individuals are shown as filled symbols. Genotypes are shown below each individual who was genotyped. (c) Percentages of different clinical features variably expressed in UBA2-affected individuals based on available data. Previously reported UBA2 patients are also included in the percentages. |
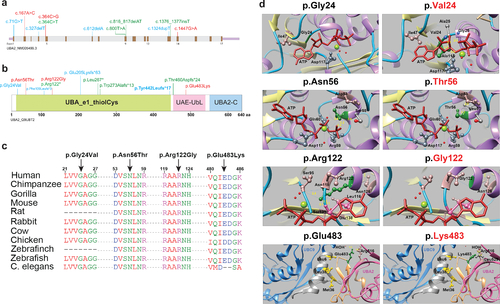
Fig. 2. UBA2 syndrome–associated variants and molecular modeling. (a) Schematic representation of the UBA2 gene. Exons are shown in brown color boxes; introns and 3’ and 5’ UTRs are in light gray and purple, respectively. Newly reported UBA2 missense and loss-of-function variants are shown in red and green, respectively, while blue is used to represent previously reported UBA2 variants. (b) Schematic representation of UBA2 protein domains. The UBA2 protein domain carrying catalytically active sites of ubiquitin-activating enzyme is shown in light green. This domain has putative active sites to bind ATP, substrate, and zinc with the last of five conserved cysteine residues playing an important role in ubiquitin thioester complex formation. UBA2-C (C-terminus) and UAE-UbL (ubiquitin-like) domains are shown in pink and blue, representing the C-terminus of UBA2 protein. UAE-UbL is structurally similar to ubiquitin and is involved in E1-SUMO-thioester transfer to E2 conjugation protein. The amino acid changes for the aforementioned variants are shown in the same color scheme as (b). (c) Amino acid sequence alignments of the human UBA2 protein across different species at each of the residues reported with missense variants. (d) Molecular modeling of human UBA2 protein. Secondary structure helix, strand and coil regions are shown in purple, yellow and cyan blue shades, respectively. Forest green color is used to show residues of interest in proteins with wild type (WT) and missense changes and the ATP molecule is shown in brick red color. Blue color shows regions of hydrogen bonding and light pink shows residues involved in hydrogen bond formation with residues of interest. The distances to nearby residues are shown by dashed yellow lines. Last panel: UBA2 and UBC9 are shown in hot pink and cyan blue color, respectively. As per molecular modeling predictions, p.Gly24Val: Glycine is flexible enough to maintain torsion angles and is buried in the protein core to maintain local secondary structure. p.Asn56Thr. Introducing a smaller but more hydrophobic residue at Asparagine 56 results in an empty space in the protein core and subsequent loss of hydrogen bonding with Asp53. p.Arg122Gly: The typical Arginine 122 residue is involved in hydrogen bonding with Asn118, Gly138 and Ser139. Replacement with Glycine is predicted to disrupt this array. |
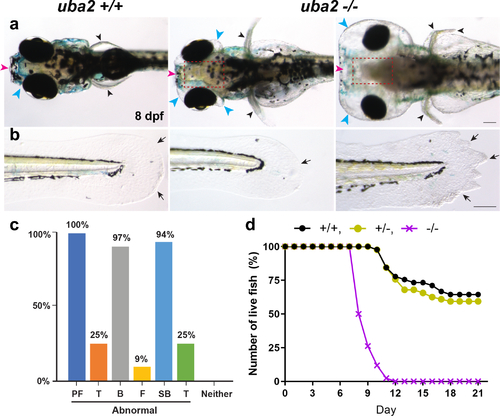
Fig. 3. Severe dysmorphic features in embryonic uba2-/- zebrafish. (a, b) Dorsal and lateral views of uba2 zebrafish at 8 dpf. Compared to wild-type (WT) controls, mutant lines showed aberrant head development with small eyes and hydrocephalus. (c) Bar graph representing the percentage of uba2-/- zebrafish with gross morphological defects. (d) Survival curve showing the number of live fish over the course of 21 days. WT and heterozygous fish showed similar death curves, but homozygous fish had steeper death curves with 100% mortality by day 12. B brain, F craniofacial, PF pectoral fins, SB swim bladder, T tail. PHENOTYPE:
|
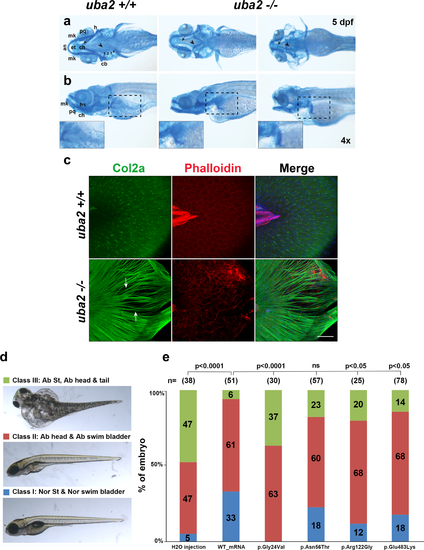
Fig. 4. Cranial cartilage patterns observed in uba2-/- zebrafish and rescue of uba2 mutant phenotype with human UBA2 messenger RNA (mRNA). (a, b) Brightfield ventral and lateral views of cartilage stained uba2 in wild type (WT) and homozygous mutant fish are shown in top and bottom panels, respectively. Closeups of pectoral fin cartilage phenotype are shown in inserts in the bottom panel highlighted by black dashed boxes on lateral views. an anterior, cb ceratobranchials 1–4, ch ceratohyal, ep ethmoid plate, h hypohyal, hs hyosymplectic, mk Meckel’s cartilage, pq palatoquadrate. (c) Z-stack images of uba2 zebrafish median fins stained with Col2a (green), Rhodamine-Phalloidin (red), and Dapi (blue). Arrows are used to show the gaps between actinotrichia fibers. Scale bar: 50 µm. (d) Suppression of uba2 in zebrafish produces an abnormal phenotype that is classified into three categories. (e) Proportions of uba2-/- zebrafish embryos representing each phenotype category after injecting with WT or mutation harboring human UBA2 mRNA. Landmark abbreviations: Ab abnormal, Nor St normal structure, ns not significant. Chi Square test p values are shown above the phenotypes for each rescue experiment. |