
- Title
-
Untargeted lipidomics reveals the toxicity of bisphenol A bis(3-chloro-2- hydroxypropyl) ether and bisphenols A and F in zebrafish liver cells
- Authors
- Marqueño, A., Pérez-Albaladejo, E., Denslow, N.D., Bowden, J.A., Porte, C.
- Source
- Full text @ Ecotoxicol. Environ. Saf.
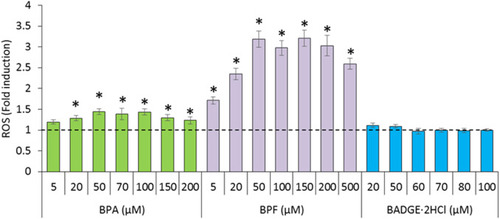
ROS production in ZFL cells after 15 min of exposure to different concentrations of BPA, BPF, and BADGE·2HCl expressed as fold induction ± SEM of six replicates per plate and three different plates. The dotted line represents levels of ROS in solvent control cells. 5 µM SIN-1 was used as positive control leading to 2.5 ± 0.3-fold induction. *Statistically significant differences from control (p < 0.05). |
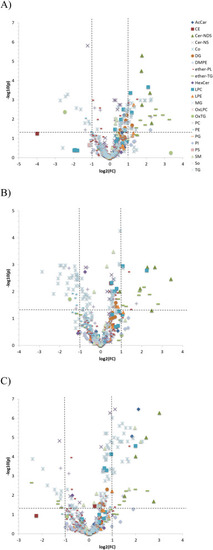
Volcano plots color-coded by lipid class showing differences in the lipid profile of ZFL cells exposed to A) 50 µM BPA, B) 50 µM BPF and C) 10 µM BADGE·2HCl compared to control cells. The x-axis reflects the magnitude (log2(fold change)) whilst the y-axis reflects the significance of change (–log(p-value)). Dotted lines delimit significantly altered lipids (fold change ≥ 2.0; FDR-adjusted p < 0.05). |
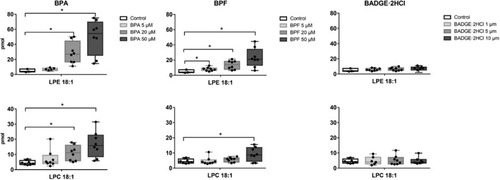
Amount of LPE 18:1 and LPC 18:1 in the culture medium of ZFL cells after exposure to BPA (5, 20, 50 µM), BPF (5, 20, 50 µM) and BADGE·2HCl (1, 5, 10 µM) for 24 h. The central line indicates the median, the bottom and top edges of the box indicate the 25th and 75th percentiles, whiskers represent 5th to 95th percentiles, and black dots represent individual measurements. *Indicates statistically significant differences (p < 0.05; Student t-test). |
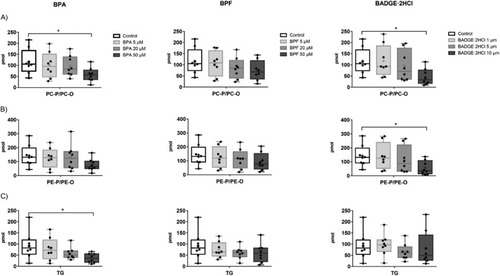
Total amount of A) PC-P/PC-Os, B) PE-P/PE-Os and C) TGs in the culture medium of ZFL cells after exposure to BPA (5, 20, 50 µM), BPF (5, 20, 50 µM) and BADGE·2HCl (1, 5, 10 µM) for 24 h. The central line indicates the median, the mean is plotted using the '+ ' symbol, the bottom and top edges of the box indicate the 25th and 75th percentiles, whiskers represent 5th to 95th percentiles, and black dots represent individual measurements. *Indicates statistically significant differences (p < 0.05; Student t-test). |
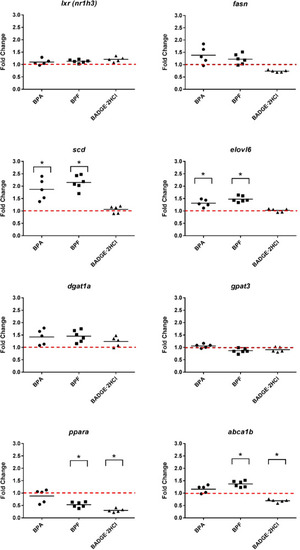
Changes in the expression of hepatic genes related to lipid metabolism pathway in response to 20 µM BPA and BPF, and 5 µM BADGE·2HCl in ZFL cells. The red dotted line indicates control value. *Statistically significant differences from control (p < 0.05; n = 5–6 biological replicates from different cell passages). |
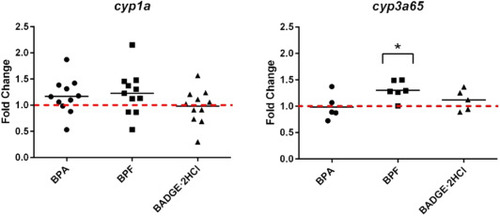
Changes in the expression of hepatic cyp1a and cyp3a65 genes in response to 20 µM BPA and BPF, and 5 µM BADGE·2HCl in ZFL cells. The red dotted line indicates control value. *Statistically significant differences from control (p < 0.05; n = 5–11). |