
Image
|
Figure Caption
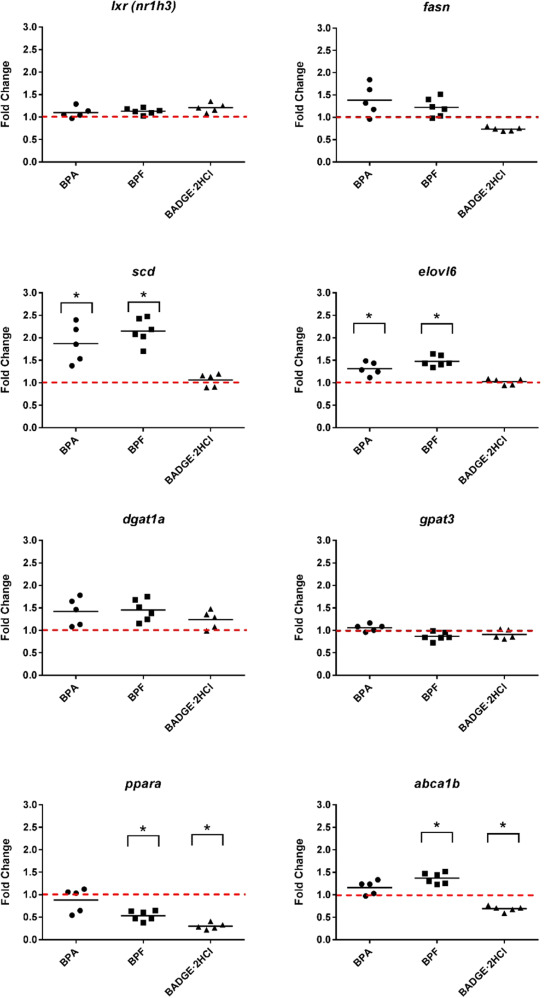
Fig. 5 Changes in the expression of hepatic genes related to lipid metabolism pathway in response to 20 µM BPA and BPF, and 5 µM BADGE·2HCl in ZFL cells. The red dotted line indicates control value. *Statistically significant differences from control (p < 0.05; n = 5–6 biological replicates from different cell passages).
Acknowledgments
This image is the copyrighted work of the attributed author or publisher, and
ZFIN has permission only to display this image to its users.
Additional permissions should be obtained from the applicable author or publisher of the image.
Full text @ Ecotoxicol. Environ. Saf.