
Image
|
Figure Caption
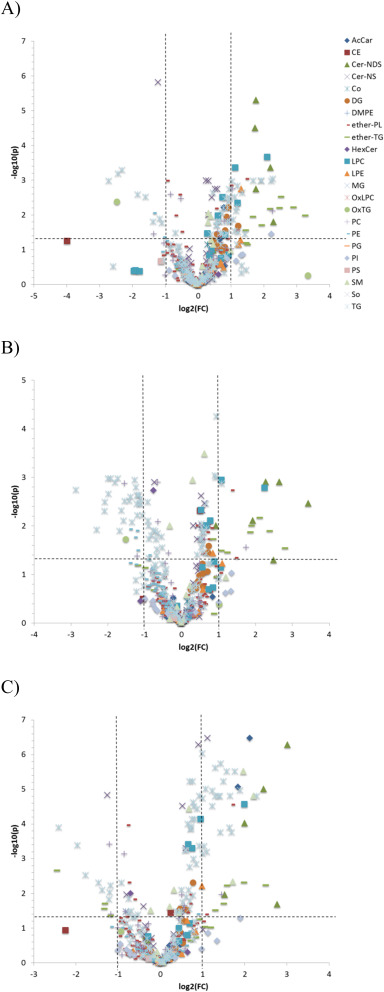
Fig. 2 Volcano plots color-coded by lipid class showing differences in the lipid profile of ZFL cells exposed to A) 50 µM BPA, B) 50 µM BPF and C) 10 µM BADGE·2HCl compared to control cells. The x-axis reflects the magnitude (log2(fold change)) whilst the y-axis reflects the significance of change (–log(p-value)). Dotted lines delimit significantly altered lipids (fold change ≥ 2.0; FDR-adjusted p < 0.05).
Acknowledgments
This image is the copyrighted work of the attributed author or publisher, and
ZFIN has permission only to display this image to its users.
Additional permissions should be obtained from the applicable author or publisher of the image.
Full text @ Ecotoxicol. Environ. Saf.