
Image
|
Figure Caption
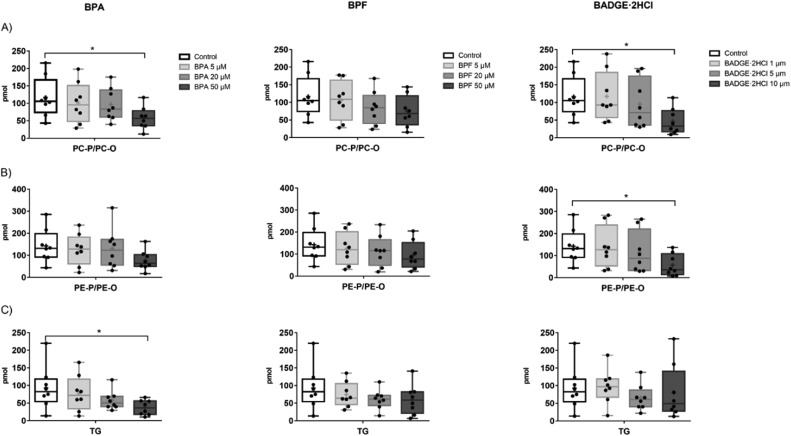
Fig. 4 Total amount of A) PC-P/PC-Os, B) PE-P/PE-Os and C) TGs in the culture medium of ZFL cells after exposure to BPA (5, 20, 50 µM), BPF (5, 20, 50 µM) and BADGE·2HCl (1, 5, 10 µM) for 24 h. The central line indicates the median, the mean is plotted using the '+ ' symbol, the bottom and top edges of the box indicate the 25th and 75th percentiles, whiskers represent 5th to 95th percentiles, and black dots represent individual measurements. *Indicates statistically significant differences (p < 0.05; Student t-test).
Acknowledgments
This image is the copyrighted work of the attributed author or publisher, and
ZFIN has permission only to display this image to its users.
Additional permissions should be obtained from the applicable author or publisher of the image.
Full text @ Ecotoxicol. Environ. Saf.