Decreased presence of ADAMTS-5 within the aneurysmal wall. (A) Representative immunofluorescence performed on intracranial aneurysm samples harvested from human IA patients after microsurgical clipping, and the normal cerebral artery harvested from a human brain trauma patient, showing the presence of ADAMTS-5. ADAMTS-5 and Collagen IV are displayed in red and green, respectively. Scale bars: 20 μm. (B) CTA identification of aneurysms from the patients included in this study. Human IA sample 1 and sample 2 were obtained from IA patient 1 and patient 2, respectively. (C, D) Representative immunofluorescence performed on mouse samples displaying the healthy control artery and aneurysmal artery for ADAMTS-5. Scale bars: 20 μm. ATS5, ADAMTS-5; COLL IV, Collagen IV.

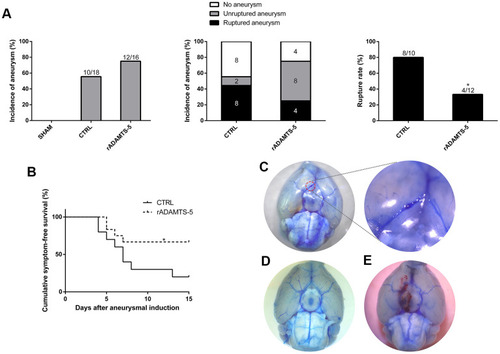
Effects of recombinant protein ADAMTS-5 on the development of aneurysmal rupture in male mice. (A) Incidence of aneurysm and rupture rate in sham mice, control (CTRL) IA mice, and recombinant protein ADAMTS-5-administered (rADAMTS-5) IA mice. (B) Symptom-free curve (Kaplan-Meier analysis curve) demonstrated a significant increase in survival in the rADAMTS-5 treatment cohort (log-rank P<0.05). (C) Unruptured aneurysm. (D) No aneurysm. (E) Ruptured aneurysm. *P<0.05, **P<0.01.

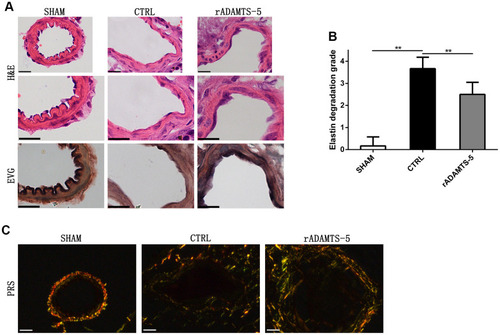
Recombinant protein ADAMTS-5 protected elastase-induced IA mice from vascular matrix degradation. (A) Representative hematoxylin and eosin (H&E) and elastin Verhoeff-Van Gieson (EVG)-stained section of cerebral arterial sections of sham mice, control (CTRL) IA mice, and recombinant protein ADAMTS-5-administered (rADAMTS-5) IA mice. Scale bar: 20 μm. (B) Quantification histogram showing elastin filament degradation. Arterial wall elastin filament degradation was evaluated based on the degree of degradation in elastin fibers (graded 0–4) as described in the Materials and Methods. **P<0.01. (C) Picrosirius red staining for collagen content within the arteries captured by polarization microscopy imaging from the sham mice, control IA mice, and recombinant protein ADAMTS-5-administered (rADAMTS-5) IA mice. Compared with the control group, the rADAMTS-5-administered group showed increased collagen birefringence under polarization. Scale bar: 20 μm.

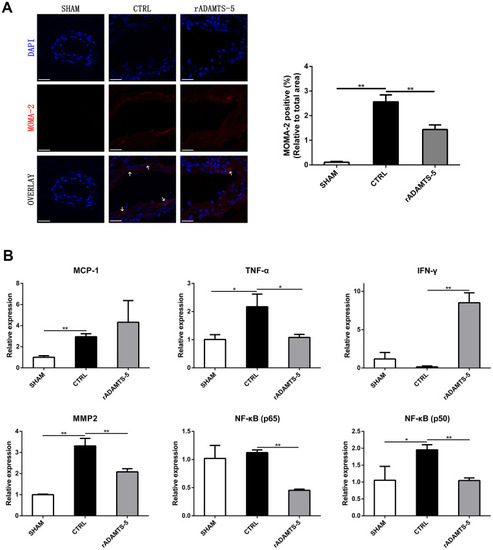
Effects of rADAMTS-5 on monocyte/macrophage infiltration and inflammatory mediators within the IA artery. (A) Immunostaining for macrophages (white arrow) with MOMA-2 (red) of arterial sections of the sham group, control group (CTRL), and rADAMTS-5-administered group. Scale bar, 40μm. (B) Effects of rADAMTS-5 treatment on the mRNA levels of inflammatory mediators. *P<0.05, **P<0.01.

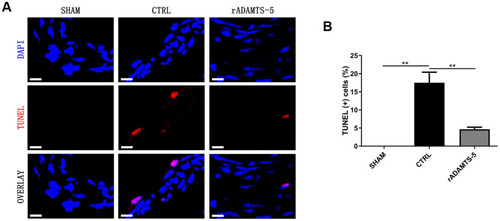
Decreased apoptosis in the IA arteries of rADAMTS-5-administered mice. (A) Representative images of TUNEL staining indicating less apoptosis (displayed in red) in arteries from rADAMTS-5-administered mice than in those from control (CTRL) mice. (B) Quantification of the TUNEL (+) cells in arteries from the control (CTRL) mice and rADAMTS-5-administered mice. **P<0.01.

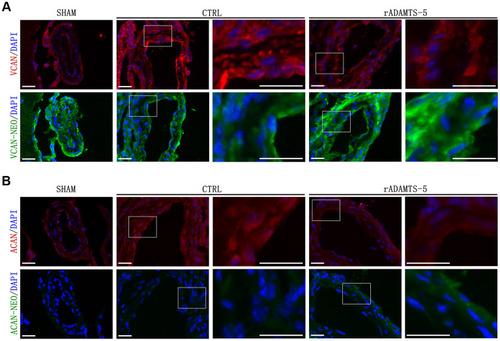
Effects of rADAMTS-5 on proteolysis and detection of the main proteoglycans in IA arteries. Representative immunofluorescence staining images showing (A) versican (VCAN) degradation and (B) aggrecan (ACAN) degradation in IA arteries from sham mice and control (CTRL) mice and in arteries from rADAMTS-5-administered mice. Images in columns 3 and 5 represent higher magnification views of the areas contained within the white boxes in the left-hand columns. Versican and aggrecan are displayed in red, and the neoepitopes of versican and aggrecan are displayed in green. Scale bar: 25 μm.

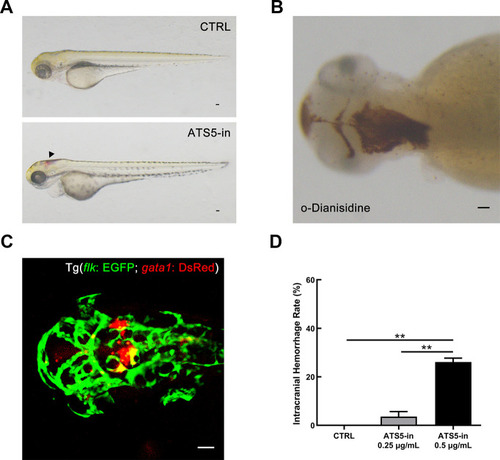
Inhibition of ADAMTS-5 causes intracranial hemorrhage in zebrafish. (A) Zebrafish embryos treated with DMSO (control, CTRL group), and intracranial hemorrhage in embryos treated with 0.5 μg/mL of ADAMTS-5 inhibitor (ATS5-in). The black arrow indicates the bleeding site. (B) O-Dianisidine staining confirming intracranial hemorrhage at 72 hpf. (C) Confocal microscopy showing cerebral blood vessel leakage of the Tg (flk: EGFP; gata1: DsRed) embryo. (D) Incidence rates of intracranial hemorrhage of the control group (CTRL) and ADAMTS-5 inhibitor treatment group (ATS5-in) at 0.25 μg/mL and 0.5 μg/mL. Scale bar: 50 μm. **P<0.01.

Acknowledgments
This image is the copyrighted work of the attributed author or publisher, and ZFIN has permission only to display this image to its users. Additional permissions should be obtained from the applicable author or publisher of the image. Full text @ Aging (Albany NY)