
- Title
-
An Arrhythmic Mutation E7K Facilitates TRPM4 Channel Activation via Enhanced PIP2 Interaction
- Authors
- Hu, Y., Li, Q., Kurahara, L.H., Shioi, N., Hiraishi, K., Fujita, T., Zhu, X., Inoue, R.
- Source
- Full text @ Cells
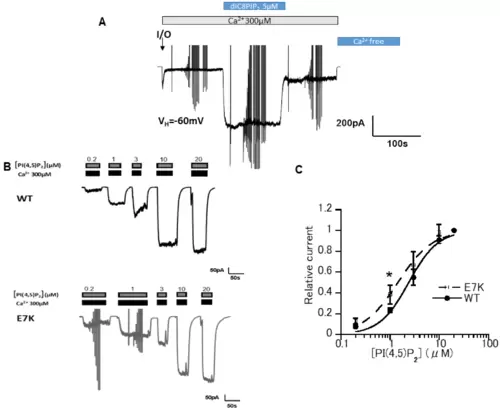
E7K mutant presented a higher PI(4,5)P28-PI(4,5)P2 (5 μM) restored TRPM4 channel activity over its initial magnitude. Vertical deflections reflect ramp- or step pulse-induced currents. (B) Representative data from two inside-out patch membranes (WT and E7K) demonstrating the dose-dependent reactivation of TRPM4 channels in response to various concentrations of diC8-PI(4,5)P2. (C) The degree of reactivation by diC8-PI(4,5)P2 (relative current) is defined as (I[x] − I[post-desens])/(I[20μM diC8-PIP2] − I[post-desens]), where I[x] and I respectively denote the amplitudes of TRPM4 currents reactivated by given (‘X’ μM) and maximal (20 μM) concentrations of diC8-PI(4,5)P2, and I[post-desens] is that of the basal TRPM4 current after desensitization to 300 μM Ca2+ [13]. Averaged concentration-response curves for the TRPM4 channel reactivation by diC8-PI(4,5)P2 are fitted by the Hill-type equation: 1/(1 + (EC50/[diC8PIP2])n. It gives EC50 values of 2.40 ± 0.23 μM and 1.44 ± 0.20 μM; Hill coefficient (n) values of 1.5 and 1.2 for WT and E7K, respectively. * p < 0.05 with ANOVA followed by Tukey’s post hoc tests (n = 5). |

Simultaneous measurement of TRPM4 current and endogenous PI(4,5)P2 level. Typical example of DrVSP-mediated TRPM4 currents’ change induced by the depolarization and the corresponding FRET changes. (A) A 1-s-long depolarizing pulse (from −60 to 120 mV; (a)) and the changes of the fluorescence intensities (in a.u.) recorded through three different filter settings, F464(D) (b), F542(A) (c), and F542(D) (d). (B) A 1-s-long depolarizing pulse (a), the time course of inward TRPM4 current inhibition during the depolarization (b), and that of the FRET ratio (FR) (c). The value of FR is calculated by the 3-cube method (see the Materials and Methods Section and text). |

Quantitative relationships between endogenous PIP2 level and whole-cell TRPM4 current amplitude for WT and E7K mutant. (A) Graded depletion of endogenous PI(4,5)P2 was attained by applying a set of depolarizing pulses of incremental duration (300–2000 ms; from −60 to 120 mV). To minimize time-dependent changes due to desensitization, a relatively low concentration of Ca2+ (1 μM) was included in the pipette to induce TRPM4 currents under the whole-cell conditions. The tree panels in the figure denote the simultaneously recorded whole-cell TRPM4 current (Im) and concomitant FRET ratio (FR) in response to depolarizing pulses of incremental duration (300–2000 ms; Vm). Prolongation of depolarizing pulses resulted in the progressive inhibition of whole-cell TRPM4 currents, the extent of which was greater for WT than E7K, despite the same degree of FR decrease (i.e., PIP2 depletion). (B) Duration-dependent inhibition of the whole-cell TRPM4 current by depolarization-induced PIP2 depletion for WT and E7K (open vs. filled circles). The duration-dependent inhibition is defined by using the ratio of TRPM4 current amplitudes before (Ipre) and after (Ipost) each depolarization according to the formula: fractional inhibition = 1 − Ipost/Ipre, which is plotted against the pulse duration. FR change is also displayed together (dashed curve). (C) The relationships between endogenous PIP2 concentration and WT- or E7K-TRPM4 channel activity (normalized whole-cell current amplitude). Endogenous PIP2 concentration was estimated from the FR value after the previous study [16] according to the formula: FRFRmax≈F2={1/(1+Kd[PI(4,5)P2])}², where FRmax was determined from PIP5K-overexpressing cells as a 1.2-fold higher value than that evaluated from the control cells [16]. The apparent Kd values of PI(4,5)P2 binding to WT- TRPM4 channels and E7K-mutant TRPM4 channels determined by this method were 1.06 ± 0.05 μM and 0.97 ± 0.02 μM, respectively. *: p < 0.05 with ANOVA followed by Tukey’s post hoc tests (n = 5). (D) Time courses of the whole-cell TRPM4 currents recovering from depolarization-induced, DrVSP-mediated inhibition for WT (red curve in a) and E7K (blue curve in a). The time constant of recovery (τ) was determined by mono-exponential fitting, which resulted in values of 17.56 ± 5.29 and 13.71 ± 4.24 s for WT and E7K, respectively (b). *: p < 0.05 with unpaired t-test, respectively (n = 5). |
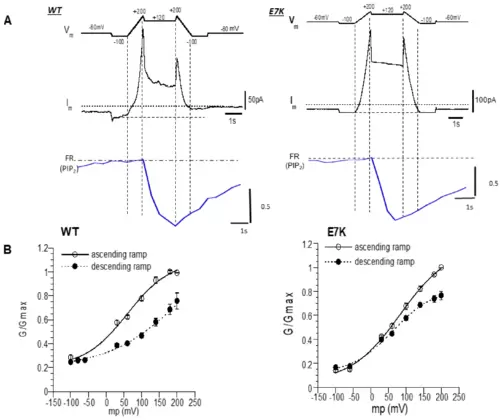
Different voltage dependence between the WT-TRPM4 channel and E7K-mutant TRPM4 channel after VSP-induced PIP2 depletion. (A) The left and right three panels show data from WT and E7K, respectively. Top panel (Vm): a dual-ramp protocol consisting of an ascending ramp of 1 s, sustained depolarization at +120 mV for 2 s, and a descending ramp of 1 s. The ramps spanned between −100 and 200 mV. Middle and bottom panels (Im and FR): representative simultaneous recordings of membrane currents and FRET ratios (which represent the endogenous PIP2 level) during Vm changes. (B) Chord conductance (G)-Vm relationships for WT- and E7K-mutant TRPM4 channels before (open circles) and after (filled circles) DrVSP-mediated PIP2 depletion. The values of G/Gmax were calculated from the data as shown in A, and the Gmax was taken as the maximal G value at 200 mV of the ascending ramp. After PIP2 depletion, the voltage dependence of the WT-TRPM4 channel was remarkably rightward shifted. In contrast, this shift was only marginal for E7K mutant, especially around the resting membrane potential. After fitting of these G-V data to the Boltzmann equation: G/Gmax = G0/Gmax + (Gmax − G0)/(1 + exp((V0.5 − Vm)/s) (Vm, V0.5, s: membrane potential, half-maximal activation voltage, slope factor, respectively), the V0.5 values before and after DrVSP activation: 62.07 ± 7.32 and 83.31 ± 9.53 vs. 59.63 ± 10.79 and 219.84 ± 75.37; and the s values before and after DrVSP activation (mV): 58.79 ± 11.46 mV and 70.45 ± 12.69 mV vs. 60.04 ± 18.52 mV and 101.58 ± 26.29, were obtained for the E7K-mutant and WT-TRPM4 channels, respectively (n = 8). Note that in both WT and E7K, there appeared to be a substantial non-voltage-dependent component (G0/Gmax) at very negative potentials, which may reflect incomplete PIP2 depletion by a 2-s depolarization to +120 mV. |

Different degrees of inhibition by WT- and E7K-N-terminal polypeptides of TRPM4 channels. (A) Current-voltage (I-V) relationships of full-length WT-TRPM4 channel co-expressed in HEK293 cells with either WT- or E7K-N-terminal polypeptides (the first 100 amino acid residues), or an empty vector alone (a). TRPM4 current was induced by 1 μM Ca2+ under the whole-cell conditions. The densities of inward and outward TRPM4 currents were compared at membrane potentials of −120, −60, 100, and 200 mV (b). The E7K polypeptide was more effective than WT polypeptide at inhibiting whole-cell TRPM4 currents. *: p < 0.05 with ANOVA followed by Tukey’s post hoc tests (n = 7). Only the pairs of columns that show statistically significant differences are shown. (B) Direct application of short synthetic N-terminal polypeptides containing the ‘WT’ and ‘E7K’ sequences suppressed single-TRPM4 channel activities induced by 100 μM Ca2+ at −60 mV. Representative data from two inside-out patches showing greater inhibition by E7K- than WT polypeptides. *: p < 0.05 with unpaired t-test, respectively (n = 5). |