
Fig. 4
- ID
- ZDB-FIG-210526-55
- Publication
- Hu et al., 2021 - An Arrhythmic Mutation E7K Facilitates TRPM4 Channel Activation via Enhanced PIP2 Interaction
- Other Figures
- All Figure Page
- Back to All Figure Page
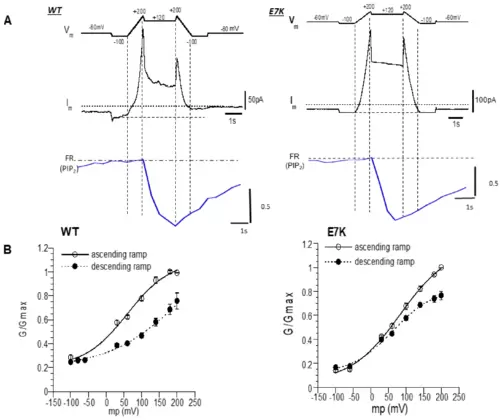
Different voltage dependence between the WT-TRPM4 channel and E7K-mutant TRPM4 channel after VSP-induced PIP2 depletion. (A) The left and right three panels show data from WT and E7K, respectively. Top panel (Vm): a dual-ramp protocol consisting of an ascending ramp of 1 s, sustained depolarization at +120 mV for 2 s, and a descending ramp of 1 s. The ramps spanned between −100 and 200 mV. Middle and bottom panels (Im and FR): representative simultaneous recordings of membrane currents and FRET ratios (which represent the endogenous PIP2 level) during Vm changes. (B) Chord conductance (G)-Vm relationships for WT- and E7K-mutant TRPM4 channels before (open circles) and after (filled circles) DrVSP-mediated PIP2 depletion. The values of G/Gmax were calculated from the data as shown in A, and the Gmax was taken as the maximal G value at 200 mV of the ascending ramp. After PIP2 depletion, the voltage dependence of the WT-TRPM4 channel was remarkably rightward shifted. In contrast, this shift was only marginal for E7K mutant, especially around the resting membrane potential. After fitting of these G-V data to the Boltzmann equation: G/Gmax = G0/Gmax + (Gmax − G0)/(1 + exp((V0.5 − Vm)/s) (Vm, V0.5, s: membrane potential, half-maximal activation voltage, slope factor, respectively), the V0.5 values before and after DrVSP activation: 62.07 ± 7.32 and 83.31 ± 9.53 vs. 59.63 ± 10.79 and 219.84 ± 75.37; and the s values before and after DrVSP activation (mV): 58.79 ± 11.46 mV and 70.45 ± 12.69 mV vs. 60.04 ± 18.52 mV and 101.58 ± 26.29, were obtained for the E7K-mutant and WT-TRPM4 channels, respectively (n = 8). Note that in both WT and E7K, there appeared to be a substantial non-voltage-dependent component (G0/Gmax) at very negative potentials, which may reflect incomplete PIP2 depletion by a 2-s depolarization to +120 mV. |