
|
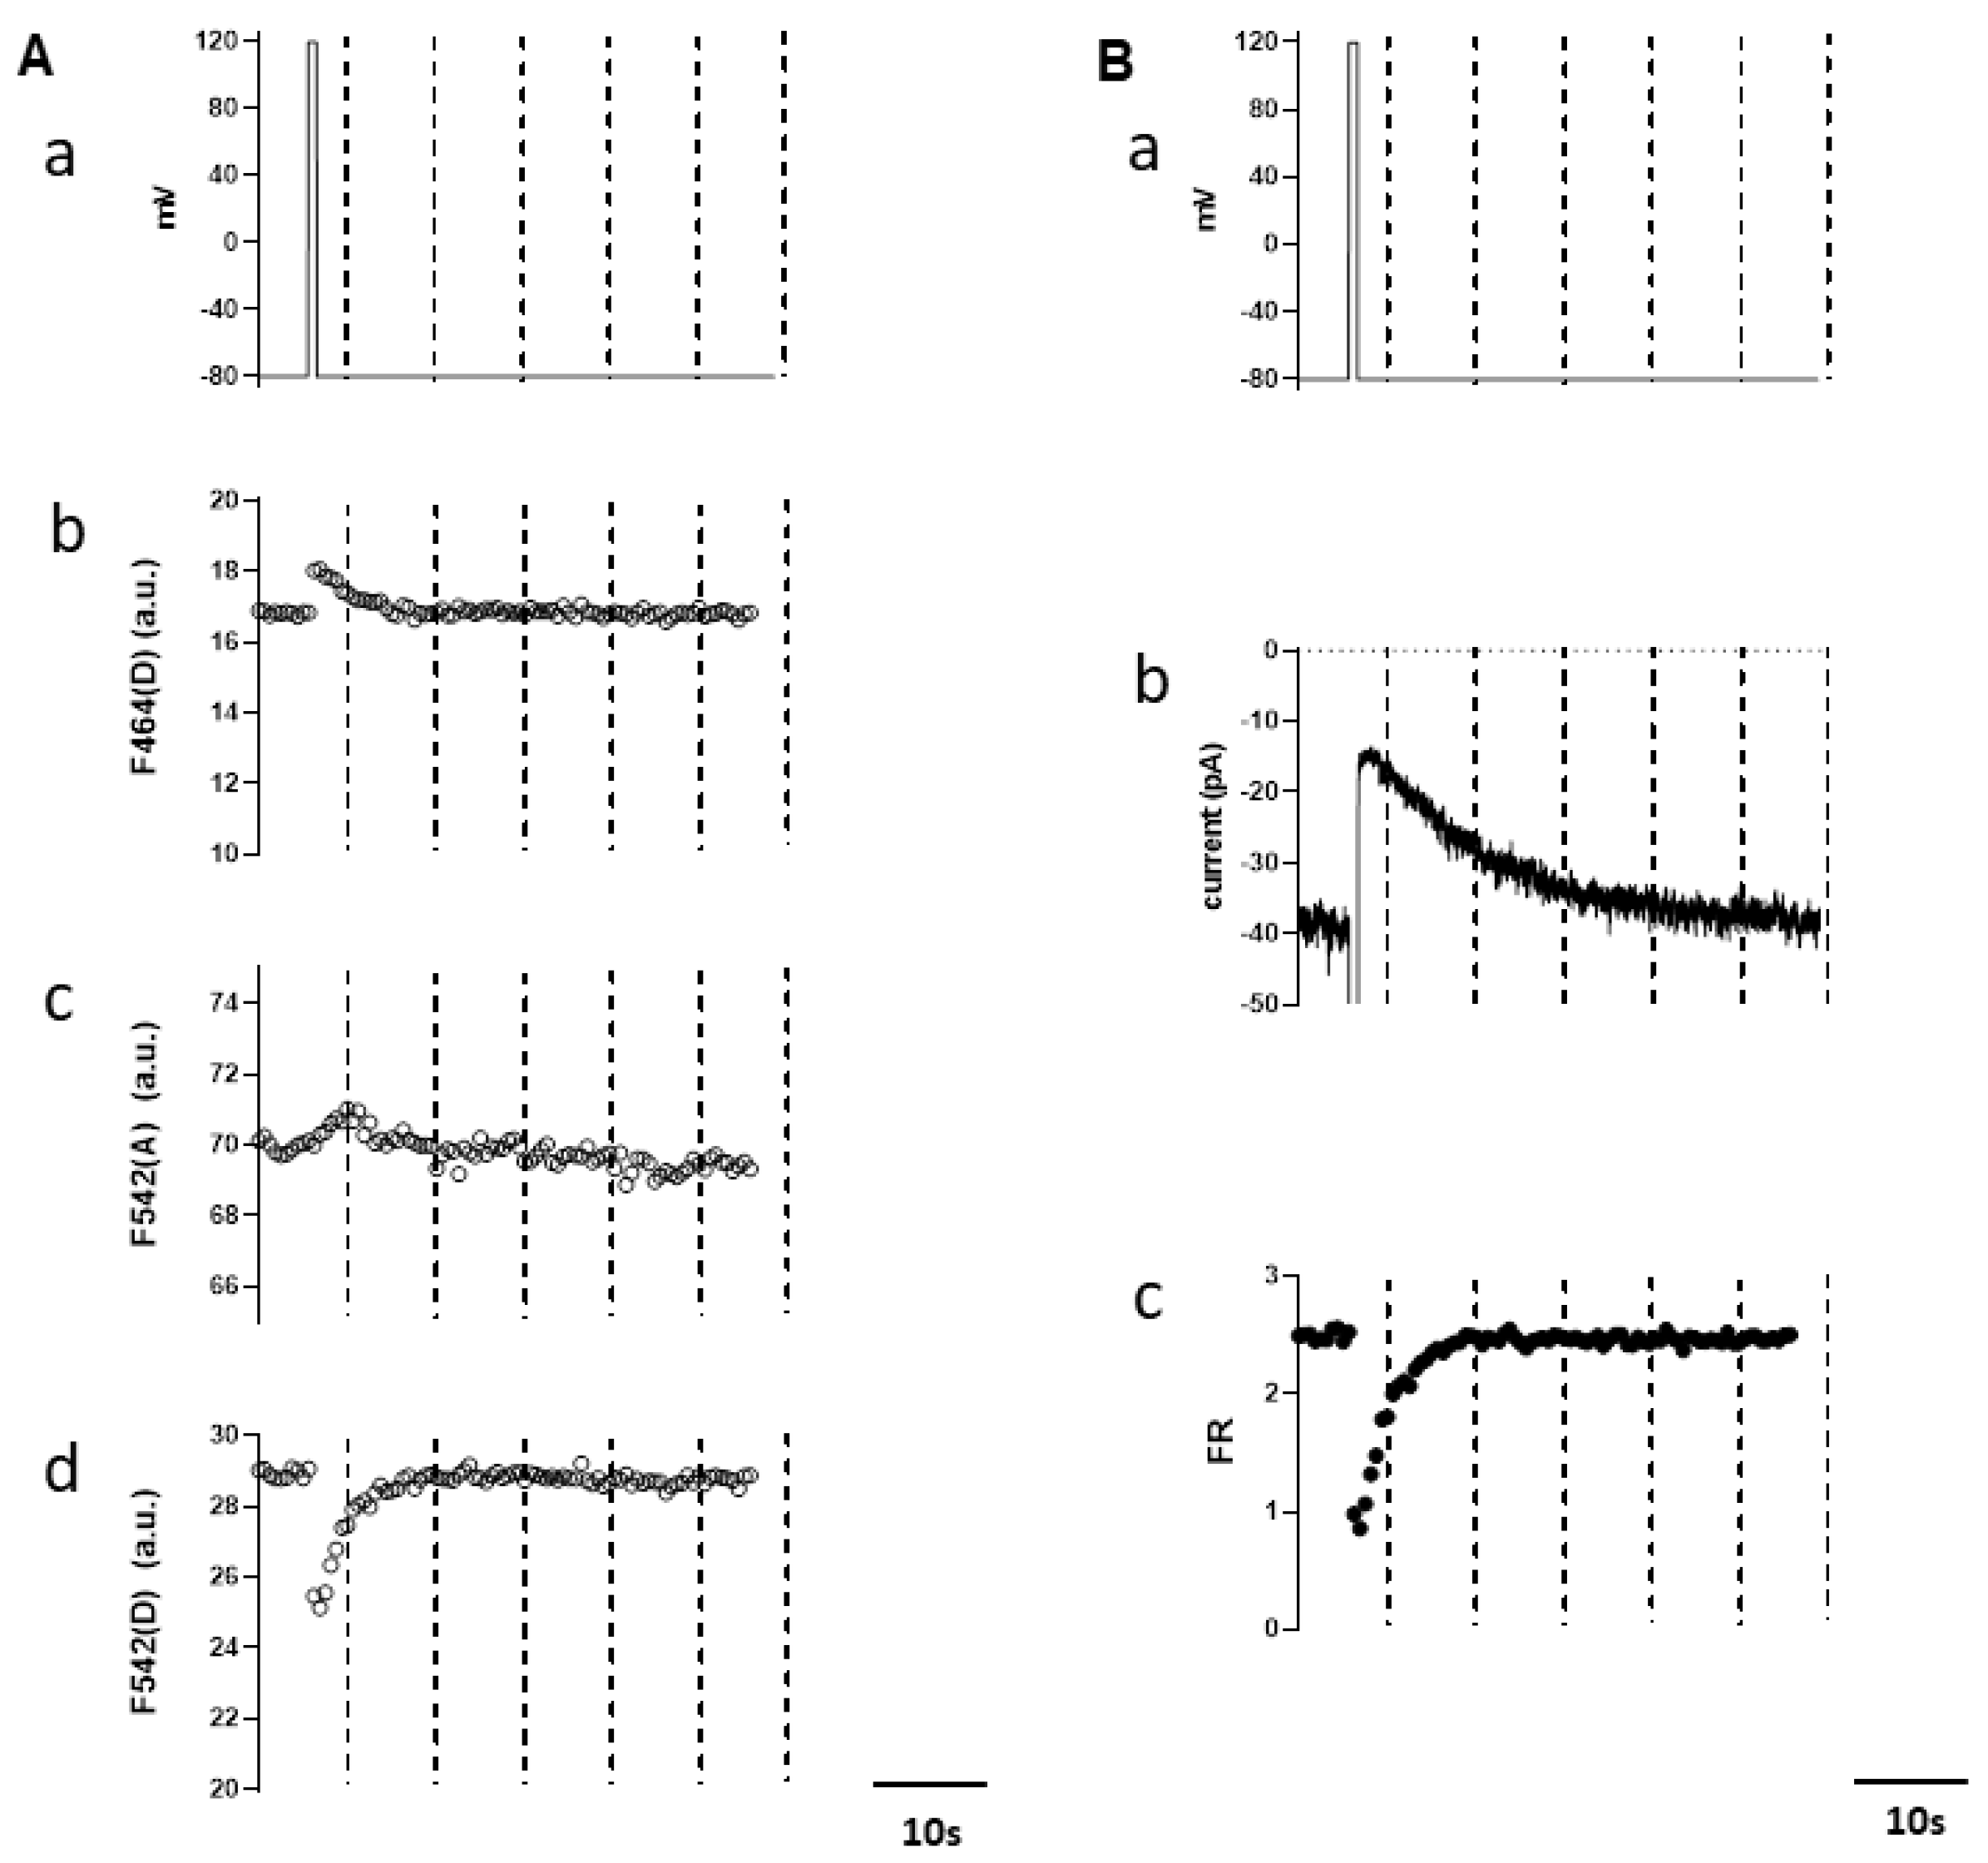
Fig. 2 Simultaneous measurement of TRPM4 current and endogenous PI(4,5)P2 level. Typical example of DrVSP-mediated TRPM4 currents’ change induced by the depolarization and the corresponding FRET changes. (A) A 1-s-long depolarizing pulse (from −60 to 120 mV; (a)) and the changes of the fluorescence intensities (in a.u.) recorded through three different filter settings, F464(D) (b), F542(A) (c), and F542(D) (d). (B) A 1-s-long depolarizing pulse (a), the time course of inward TRPM4 current inhibition during the depolarization (b), and that of the FRET ratio (FR) (c). The value of FR is calculated by the 3-cube method (see the Materials and Methods Section and text).