
- Title
-
Mycobacterial fatty acid catabolism is repressed by FdmR to sustain lipogenesis and virulence
- Authors
- Dong, W., Nie, X., Zhu, H., Liu, Q., Shi, K., You, L., Zhang, Y., Fan, H., Yan, B., Niu, C., Lyu, L.D., Zhao, G.P., Yang, C.
- Source
- Full text @ Proc. Natl. Acad. Sci. USA
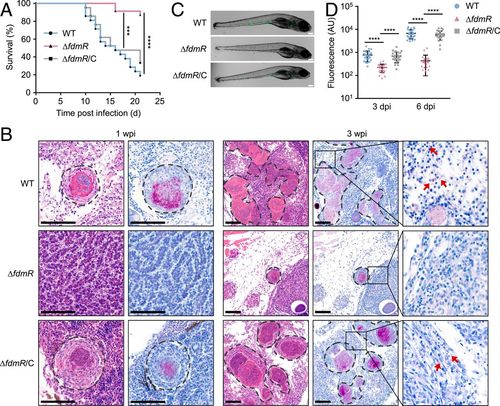
FdmR is crucial for M. marinum virulence. (A) Survival of adult zebrafish infected with M. marinum wild type (WT), ∆fdmR mutant, and complemented strain ∆fdmR/C. n = 25 per group. ***P < 0.001, ****P < 0.0001 by Kaplan–Meier method with a log-rank test. (B) Hematoxylin–eosin (Left) and Ziehl–Neelsen (Right) stains of adult zebrafish at 1 wpi and 3 wpi. (Scale bars, 100 μm.) Dotted lines delineate granulomas. The boxed areas are enlarged on the right and arrows indicate bacteria outside granulomas. Results are representative of three experiments. (C) Representative images of zebrafish larvae infected with the M. marinum strains carrying a fluorescent protein-expressing plasmid at 6 dpi. (Scale bars, 200 μm.) (D) Bacterial burdens of zebrafish larvae at 3 dpi and 6 dpi. n = 25 per group. ****P < 0.0001 by unpaired two-tailed t test. PHENOTYPE:
|
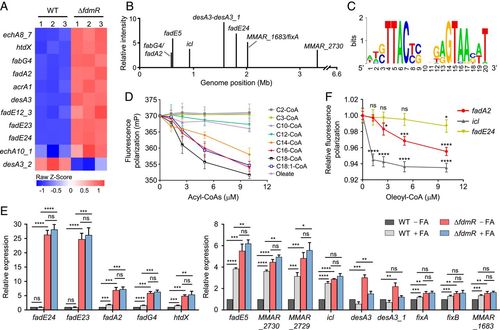
Identification of FdmR regulon and effector molecules. (A) Heat map showing relative expression levels of the genes involved in fatty acid metabolism in M. marinum. The strains were grown in 7H9 medium with glycerol and OADC enrichment. Data shown are from three independent experiments. (B) Genome-wide FdmR-binding sites identified by ChIP-Seq. (C) Sequence logo of the FdmR-binding motif derived from ChIP-Seq enriched sequences. (D) Effect of various acyl-CoAs and oleate on the FdmR-DNA interaction determined by FPAs. The DNA operator of fadA2 was used. (E) Effect of long-chain fatty acid supplementation on expression of FdmR target genes in wild type and ∆fdmR mutant. The strains were grown in 7H9 with glycerol and glucose. Long-chain fatty acids were added to the medium as indicated. The expression levels of each gene were determined by qRT-PCR and normalized to the gene expression in the wild type grown in the absence of fatty acids. (F) Effect of oleoyl-CoA on the interaction of FdmR with various DNA operators. Data are normalized to the value in the absence of oleoyl-CoA. Data shown in D, E, and F are mean ± SD (n = 3 independent experiments). *P < 0.05, **P < 0.01, ***P < 0.001, ****P < 0.0001, not significant (ns), by unpaired two-tailed t test with false discovery rate correction. |
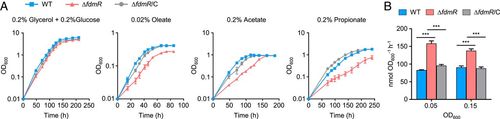
FdmR deficiency results in impaired growth and increased substrate consumption of M. marinum on fatty acids. (A) Growth of M. marinum wild type, ∆fdmR mutant, and complemented strain ∆fdmR/C in modified Sauton’s medium supplemented with glycerol and glucose, oleate, acetate, or propionate as the only carbon source. (B) Oleate consumption rate per OD600. Data shown are mean ± SD (n = 3 independent experiments). ***P < 0.001, by unpaired two-tailed t test. |
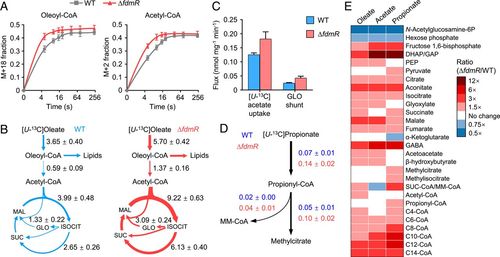
FdmR deficiency results in overactive catabolism of fatty acids. (A) Kinetics of labeling of oleoyl-CoA and acetyl-CoA after switching M. marinum cells to [U-13C]oleate medium. Data shown are mean ± SD (n = 3 independent experiments). (B) In vivo fluxes in fatty acid catabolism in M. marinum wild type and ∆fdmR mutant. ISOCIT, isocitrate; GLO, glyoxylate; SUC, succinate; MAL, malate. (C) In vivo fluxes of acetate assimilation and glyoxylate shunt in wild type and ∆fdmR mutant. (D) In vivo fluxes through methylmalonyl-CoA (MM-CoA) pathway and methylcitrate cycle in wild type and ∆fdmR mutant. The strains were grown on medium containing[U-13C]oleate (B), [U-13C]acetate (C), or [U-13C]propionate (D). Data shown in B, C, and D are median ± 95% confidence interval (n = 3 independent experiments) and are expressed in nanomoles per milligram cell dry weight per minute. (E) Heat map showing the ratio of metabolite concentrations in the ∆fdmR mutant versus wild type during growth on oleate, acetate, or propionate. Data are means of three independent experiments and normalized to the values in the wild type. |

FdmR deficiency results in synthesis of shortened lipids and increased cell-wall permeability. (A) 13C fractional labeling of fatty acids in M. marinum wild type and ∆fdmR mutant grown on [U-13C]acetate. (B) Ratio of fatty acid contents in the ∆fdmR mutant versus wild type during growth on oleate, acetate, or propionate. Gray color indicates that fatty acid is below detection limits. Data are means of three independent experiments, normalized to the values in the wild type. (C) Relative abundance of major lipids in M. marinum ∆fdmR mutant compared to the wild type. The strains were grown in 7H9 with glycerol and OADC. Abbreviations of phospholipids: PE, phosphatidylethanolamine; PI, phosphatidylinositol; PG, phosphatidylglycerol; PA, phosphatidic acid; PS, phosphatidylserine; PIM, phosphatidylinositol mannoside; CL, cardiolipin. (D) Fractions of relatively short and long species within α-TMM and oxygenated TMM in the wild type and ∆fdmR mutant. (E) Effect of FdmR deficiency on M. marinum cell-wall permeability determined by ethidium bromide accumulation assay. Data shown in A, C, D, and E are mean ± SD (n = 3 independent experiments). **P < 0.01, ***P < 0.001, not significant (ns), by unpaired two-tailed t test. |