
- Title
-
Hepatoprotection of Lycii Fructus Polysaccharide against Oxidative Stress in Hepatocytes and Larval Zebrafish
- Authors
- Zhang, F., Zhang, X., Gu, Y., Wang, M., Guo, S., Liu, J., Zhang, X., Zhao, Z., Qian, B., Yan, Y., Yu, L., Xu, C., Liu, C., Cao, F., Qian, D., Duan, J.A.
- Source
- Full text @ Oxid Med Cell Longev
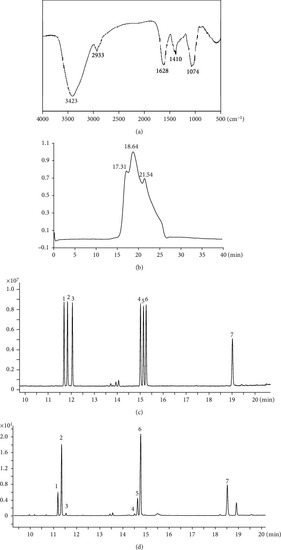
Structural analysis of LFP-a1. (a) FT-IR spectrum; (b) HPGPC profile on OHpak SB-802.5HQ column chromatographic columns; (c, d) GC-MS-based monosaccharide and uronic acid composition of (c) mixed standard and (d) LFP-a1. Peaks: (1) rhamnose, (2) arabinose, (3) xylose, (4) mannose, (5) glucose, (6) galactose, and (7) galacturonic acid. |
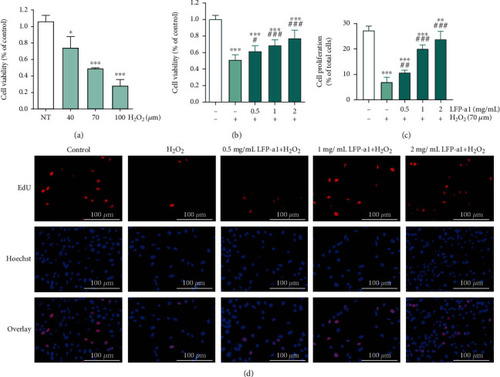
Cytotoxicity of H2O2 and protective effects of LFP-a1 in H2O2-challenged L02 cells. (a) Effect of H2O2 on cell viability of L02 cells, respectively. (b) Effect of LFP-a1 on cell viability of L02 cells against H2O2-insult. (c) Effect of LFP-a1 on cell proliferation of L02 cells against H2O2-insult. (d) Edu and Hoechst 33342 fluorescent staining of L02 cells (EdU: staining in red; Hoechst 33342: staining in blue, original magnification: ×200). Data are expressed as the () and are representative of at least three independent experiments (, , compared with control cells, #, ## compared with H2O2-challenged cells). |

LFP-a1 mitigated H2O2-induced oxidative stress scenario. (a) Effect of LFP-a1 on ROS production and oxidative stress indicators in H2O2-challenged L02 cells. (b) ROS detection images of L02 cells. Cells were treated with different concentrations of LFP-a1 and 70 μM H2O2 successively. Data were presented as mean (n=3) ± SD of three independent experiments (*p<0.05,**p<0.01,***p<0.001 compared with H2O2 groups, #p<0.05, ##p<0.01, ###p<0.001 compared with H2O2-challenged cells). |
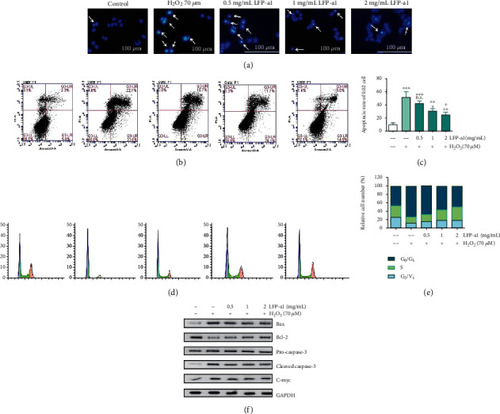
Effects of LFP-a1 on cell apoptosis and cell cycle in H2O2-challenged L02 cells. Cells were pretreated with different concentrations (0.5, 1.0, and 2 mg/mL) of LFP-a1 for 24 h prior to incubation with 70 μM H2O2 for an extra 24 h. (a) Representative fluorescent images of cells stained with Hoechst 33342 and observed under a fluorescent microscope; (b) flow cytometry analysis of apoptosis after double-staining with Annexin V-FITC/PI; (c) bar graphs of apoptotic ratio of cells analyzed by flow cytometry; (d) representative DNA histograms of cell cycle distribution after staining with PI; (e) statistical results of population in different cell cycle phases analyzed by flow cytometry; (f) protein expressions of apoptosis-associated biomarkers in L02 cells measured by Western blot. Results were expressed as mean± SD (n=3) and representative of at least three separate experiments. *p<0.05, **p<0.01, ***p<0.001 compared with control cells, #p<0.05, ##p<0.01, ###p<0.001 compared with H2O2-challenged cells. |
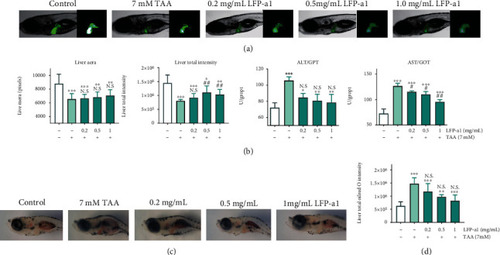
Effects of LFP-a1 on liver development and function in TAA-damaged zebrafish larvae. (a) Effects of LFP-a1 on TAA-induced morphological alterations in larvae livers (×2.5 magnification); (b) statistical effects of LFP-a1 on TAA- induced zebrafish larvae liver area, fluorescence intensity, and ALT and AST activities; (c) images of LFP-a1 on lipid accumulation in larvae livers; (d) statistical effects of LFP-a1 on lipid accumulation in larvae livers (*p<0.05, **p<0.01, ***p<0.001 compared with control larvae, #p<0.05, ##p<0.01, ###p<0.001 compared with TAA-challenged larvae, N.S.: no significance). |

LFP-a1 protected zebrafish larvae from TAA-induced oxidative stress (ROS production, NO production, antioxidant enzyme activities of SOD, GSH-Px, and CAT, GSH content, T-AOC, and MDA level). Larvae were treated with different concentrations of LFP-a1 and 7 mM TAA successively. Data were presented as mean(n=3) ± SD of three independent experiments (*p<0.05, **p<0.01, ***p<0.001 compared with control, #p<0.05, ##p<0.01, ###p<0.001 compared with TAA-challenged larvae, N.S.: no significance). |

mRNA levels of apoptosis-related gene in larval zebrafish NAFLD model measured by qPCR. Larvae were treated with different concentrations of LFP-a1 and 7 mM TAA successively. Data were presented as mean (n=3) ± SD of three independent experiments (*p<0.05, **p<0.01, ***p<0.001 compared with control, #p<0.05, ##p<0.01, ###p<0.001 compared with TAA-challenged larvae, N.S.: no significance). |