
Image
|
Figure Caption
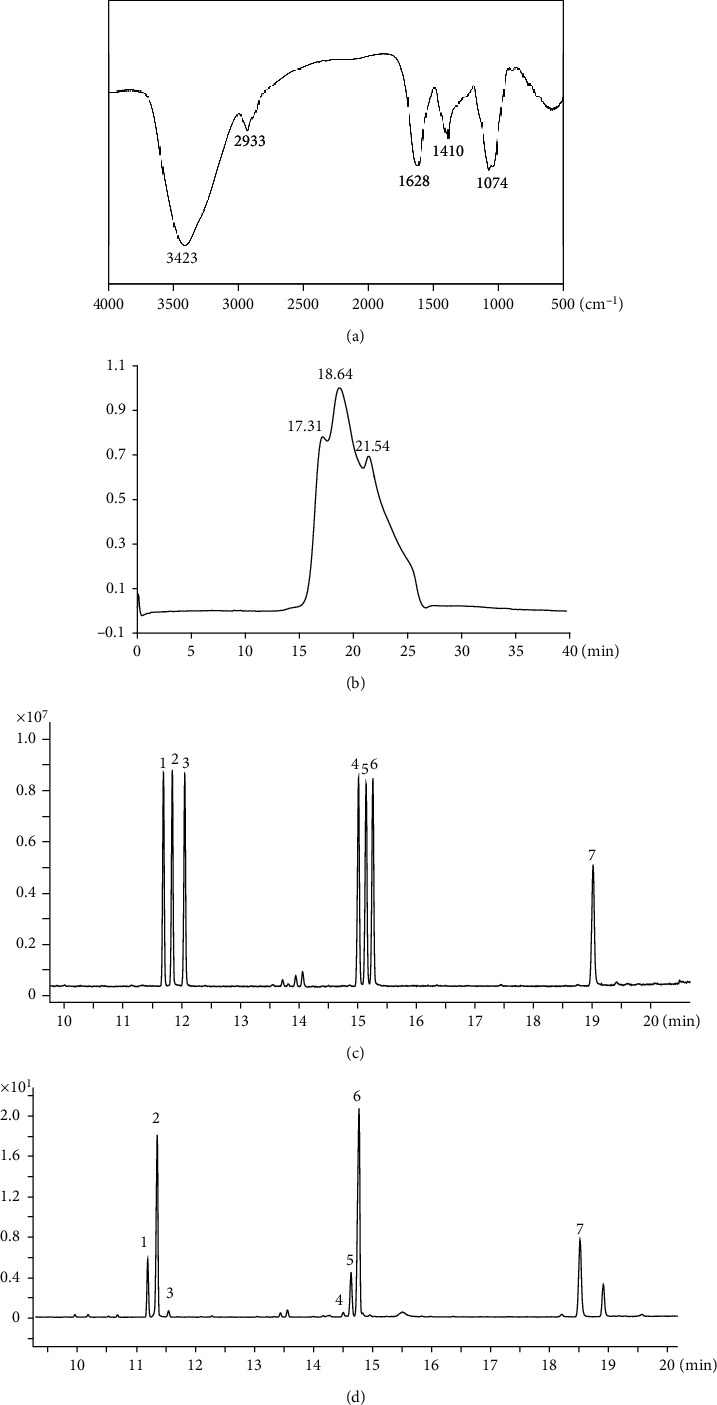
Figure 1 Structural analysis of LFP-a1. (a) FT-IR spectrum; (b) HPGPC profile on OHpak SB-802.5HQ column chromatographic columns; (c, d) GC-MS-based monosaccharide and uronic acid composition of (c) mixed standard and (d) LFP-a1. Peaks: (1) rhamnose, (2) arabinose, (3) xylose, (4) mannose, (5) glucose, (6) galactose, and (7) galacturonic acid.
Acknowledgments
This image is the copyrighted work of the attributed author or publisher, and
ZFIN has permission only to display this image to its users.
Additional permissions should be obtained from the applicable author or publisher of the image.
Full text @ Oxid Med Cell Longev