
FIGURE
Figure 1
- ID
- ZDB-FIG-210310-14
- Publication
- Zhang et al., 2021 - Hepatoprotection of Lycii Fructus Polysaccharide against Oxidative Stress in Hepatocytes and Larval Zebrafish
- Other Figures
- All Figure Page
- Back to All Figure Page
Figure 1
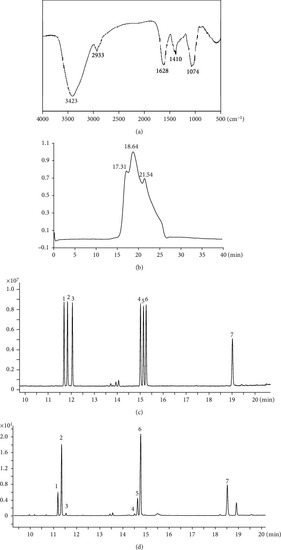
Structural analysis of LFP-a1. (a) FT-IR spectrum; (b) HPGPC profile on OHpak SB-802.5HQ column chromatographic columns; (c, d) GC-MS-based monosaccharide and uronic acid composition of (c) mixed standard and (d) LFP-a1. Peaks: (1) rhamnose, (2) arabinose, (3) xylose, (4) mannose, (5) glucose, (6) galactose, and (7) galacturonic acid. |
Expression Data
Expression Detail
Antibody Labeling
Phenotype Data
Phenotype Detail
Acknowledgments
This image is the copyrighted work of the attributed author or publisher, and
ZFIN has permission only to display this image to its users.
Additional permissions should be obtained from the applicable author or publisher of the image.
Full text @ Oxid Med Cell Longev