
|
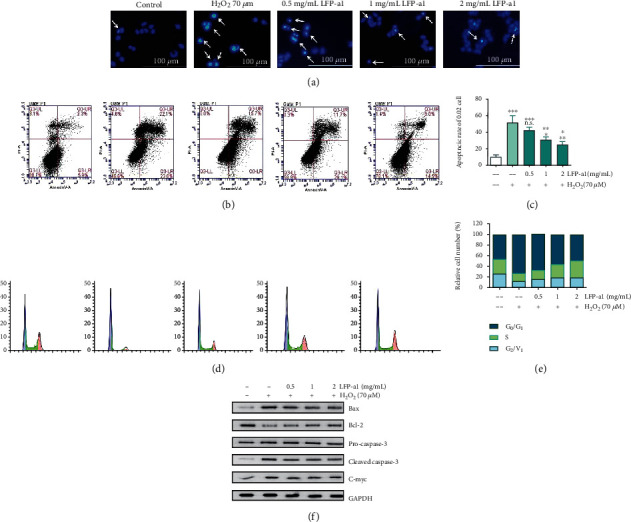
Figure 4 Effects of LFP-a1 on cell apoptosis and cell cycle in H2O2-challenged L02 cells. Cells were pretreated with different concentrations (0.5, 1.0, and 2 mg/mL) of LFP-a1 for 24 h prior to incubation with 70 μM H2O2 for an extra 24 h. (a) Representative fluorescent images of cells stained with Hoechst 33342 and observed under a fluorescent microscope; (b) flow cytometry analysis of apoptosis after double-staining with Annexin V-FITC/PI; (c) bar graphs of apoptotic ratio of cells analyzed by flow cytometry; (d) representative DNA histograms of cell cycle distribution after staining with PI; (e) statistical results of population in different cell cycle phases analyzed by flow cytometry; (f) protein expressions of apoptosis-associated biomarkers in L02 cells measured by Western blot. Results were expressed as mean± SD (n=3) and representative of at least three separate experiments. *p<0.05, **p<0.01, ***p<0.001 compared with control cells, #p<0.05, ##p<0.01, ###p<0.001 compared with H2O2-challenged cells.