FIGURE SUMMARY
Title

son is necessary for proper vertebrate blood development

Authors
Belmonte, R.L., Engbretson, I.L., Kim, J.H., Cajias, I., Ahn, E.E., Stachura, D.L.
Source
Full text @ PLoS One

Reduction in <italic>son</italic> results in impaired erythropoiesis.

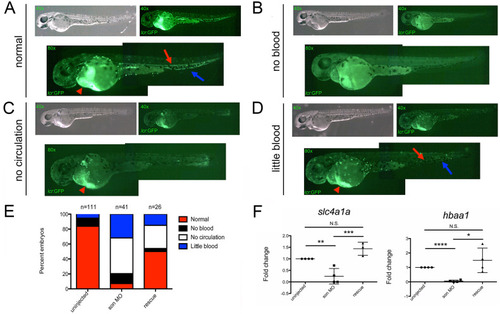
Representative images of 48hpf lcr:GFP embryos injected with son MO at the one-cell-stage of development show four common phenotypic categories associated with son MO injection. Category titles are listed to the left of each image. Brightfield images are shown in top left (40x), and fluorescent images are shown in top right (40x). Zoomed in fluorescent images are shown below (80x); each green dot in the animal is a labelled RBC. Fluorescent “trails” of green are cells moving in the vasculature. Red arrows indicate RBCs flowing though the dorsal aorta, and blue arrows indicate RBCs flowing back to the heart through the caudal vein. Red arrowheads indicate large numbers of RBCs pooled in the ducts of Cuvier, located on the yolk ball. (A) Representative images of normal RBC numbers and blood flow. (B) Representative animals with no RBCs (no blood), (C) no RBCs circulating in the animal (no circulation), and (D) reduced numbers of RBCs, some of which are circulating (little blood). (E) Quantitation of phenotypes shown. Number of embryos analyzed is shown above the chart. (F) qRT-PCR for slc4a1a (left) and hbaa1 (right) was performed. Each point represents ten embryos randomly selected from uninjected, MO-injected (son MO), or MO-injected with son RNA (rescue) conditions that were analyzed by qRT-PCR. Middle lines represent mean and error bars represent SD. * represents p = 0.04, ** represents p = 0.02, *** represents p = 0.004, **** represents p < 0.001, N.S. represents no significance.

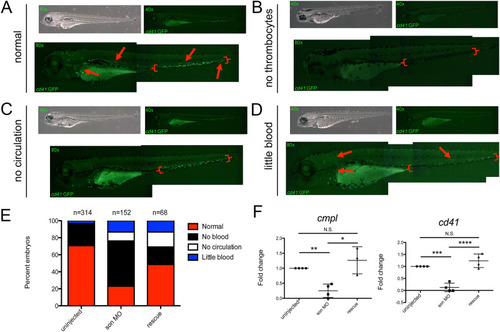
Representative images of 72hpf cd41:GFP embryos injected with son MO at the one-cell-stage of development show four common phenotypic categories associated with MO injection. Category titles are listed to the left of each image. Brightfield images are shown in top left (40x), and fluorescent images are shown in top right (40x). Zoomed in fluorescent images are shown below (80x); each green dot in the animal is a labelled thrombocyte. Red arrows indicate fluorescent “trails” made by moving thrombocytes flowing though the vasculature. Red brackets indicate the caudal hematopoietic region where the majority of thrombocytes reside at this time. (A) Representative images of normal thrombocyte numbers and circulating thrombocytes. (B) Representative animals with no thrombocytes, (C) no thrombocytes circulating in the animal (no circulation), and (D) reduced numbers of thrombocytes, some of which are circulating (little blood). (E) Quantitation of phenotypes shown. Number of embryos analyzed is shown above the chart. (F) qRT-PCR for cmpl (left) and cd41 (right) was performed. Each point represents ten embryos randomly selected from uninjected, MO-injected (son MO), or MO-injected with son RNA (rescue) conditions that were analyzed by qRT-PCR. Middle lines represent mean and error bars represent SD. * represents p = 0.04, ** represents p = 0.006, *** represents p = 0.002, **** represents p = 0.001, N.S. represents no significance.

<italic>son</italic> knockdown causes a reduction in neutrophils.

(A) Representative images of mpx:GFP embryos at 48hpf that were uninjected (left) or MO-injected (son MO, right). Images are taken at 40x, and every green dot is a labelled neutrophil; these cells are in tissues and not circulating. (B) Each point represents the number of GFP+ myeloid cells present in an individual uninjected, MO-injected (son MO), or MO-injected with son RNA (rescue) embryo. Images were taken and GFP+ cells were manually enumerated. Middle lines represent mean and error bars represent SD. (C) qRT-PCR for mpx (left) and csf3r (right) was performed. Each point represents ten embryos randomly selected from uninjected, MO-injected (son MO), or MO-injected with son RNA (rescue) conditions that were analyzed by qRT-PCR. Middle lines represent mean and error bars represent SD. * represents p = 0.02, ** represents p = 0.01, *** represents p < 0.001, N.S. represents no significance.

<italic>son</italic> reduction decreases T cell numbers.

(A) Representative images of lck:GFP embryos at 5dpf that were uninjected (control; left) or injected with MO at the one-cell-stage of development (son MO, right). Images were taken at 80x. Individual GFP+ T cells are located in the thymi (red dashed oval); these cells are not circulating. * denotes background fluorescence present in the yolk ball due to refraction of light from lipids present in the yolk. (B) Images (like shown in A) were subjected to analysis with ImageJ to determine the pixel density of uninjected, MO-injected (son MO), or MO-injected with son RNA (rescue) thymi. (C) qRT-PCR for lck was performed. Each point represents ten embryos randomly selected from uninjected, MO-injected (son MO), or MO-injected with son RNA (rescue) conditions that were analyzed by qRT-PCR. Middle lines represent mean and error bars represent SD. * represents p = 0.02, ** represents p = 0.01, *** represents p < 0.001, N.S. represents no significance.

<italic>son</italic> knockdown has little effect on erythromyeloid HSPC numbers.

(A) Experimental procedure. (B) wt embryos uninjected (left) or injected with son MO at the one-cell-stage of development (son MO, right) were dissociated at 48hpf and plated in methylcellulose media with Epo, Gcsf, and carp serum. Fold difference in colony forming units (CFUs) is shown. Each point represents ten embryos randomly selected from the respective conditions that were dissociated and plated. Middle lines represent mean and error bars represent SD. N.S. represents no significance.

Acknowledgments
This image is the copyrighted work of the attributed author or publisher, and ZFIN has permission only to display this image to its users. Additional permissions should be obtained from the applicable author or publisher of the image. Full text @ PLoS One