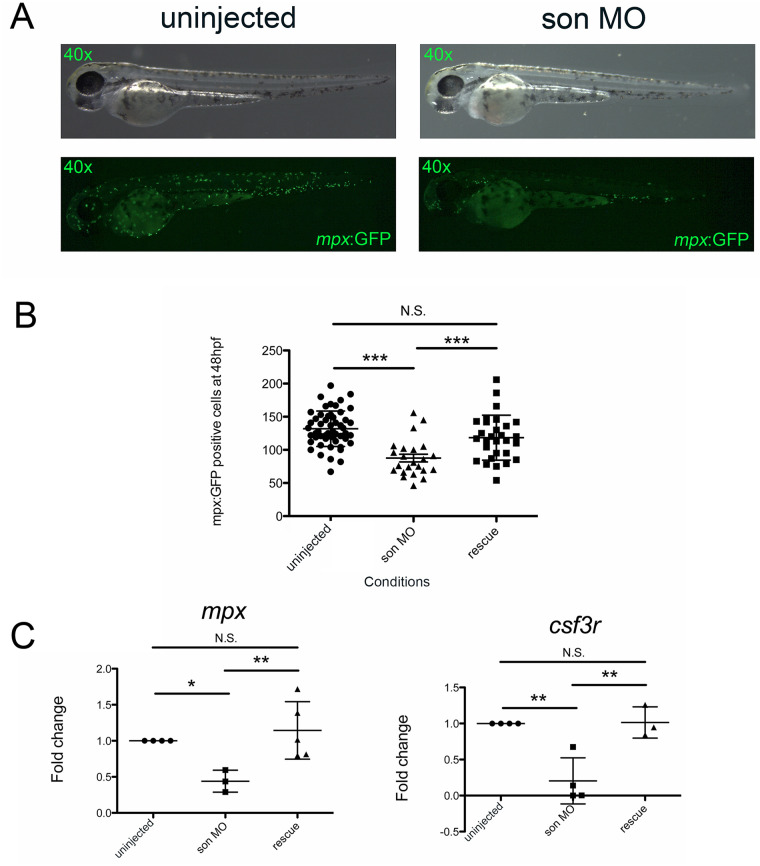
(A) Representative images of mpx:GFP embryos at 48hpf that were uninjected (left) or MO-injected (son MO, right). Images are taken at 40x, and every green dot is a labelled neutrophil; these cells are in tissues and not circulating. (B) Each point represents the number of GFP+ myeloid cells present in an individual uninjected, MO-injected (son MO), or MO-injected with son RNA (rescue) embryo. Images were taken and GFP+ cells were manually enumerated. Middle lines represent mean and error bars represent SD. (C) qRT-PCR for mpx (left) and csf3r (right) was performed. Each point represents ten embryos randomly selected from uninjected, MO-injected (son MO), or MO-injected with son RNA (rescue) conditions that were analyzed by qRT-PCR. Middle lines represent mean and error bars represent SD. * represents p = 0.02, ** represents p = 0.01, *** represents p < 0.001, N.S. represents no significance.
Acknowledgments
This image is the copyrighted work of the attributed author or publisher, and
ZFIN has permission only to display this image to its users.
Additional permissions should be obtained from the applicable author or publisher of the image.
Full text @ PLoS One
Your Input Welcome
Thank you for submitting comments. Your input has been emailed to ZFIN curators who may contact you if
additional information is required.
Oops. Something went wrong. Please try again later.