|
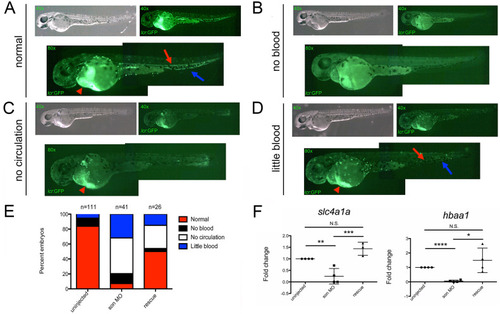
Reduction in <italic>son</italic> results in impaired erythropoiesis.Representative images of 48hpf lcr:GFP embryos injected with son MO at the one-cell-stage of development show four common phenotypic categories associated with son MO injection. Category titles are listed to the left of each image. Brightfield images are shown in top left (40x), and fluorescent images are shown in top right (40x). Zoomed in fluorescent images are shown below (80x); each green dot in the animal is a labelled RBC. Fluorescent “trails” of green are cells moving in the vasculature. Red arrows indicate RBCs flowing though the dorsal aorta, and blue arrows indicate RBCs flowing back to the heart through the caudal vein. Red arrowheads indicate large numbers of RBCs pooled in the ducts of Cuvier, located on the yolk ball. (A) Representative images of normal RBC numbers and blood flow. (B) Representative animals with no RBCs (no blood), (C) no RBCs circulating in the animal (no circulation), and (D) reduced numbers of RBCs, some of which are circulating (little blood). (E) Quantitation of phenotypes shown. Number of embryos analyzed is shown above the chart. (F) qRT-PCR for slc4a1a (left) and hbaa1 (right) was performed. Each point represents ten embryos randomly selected from uninjected, MO-injected (son MO), or MO-injected with son RNA (rescue) conditions that were analyzed by qRT-PCR. Middle lines represent mean and error bars represent SD. * represents p = 0.04, ** represents p = 0.02, *** represents p = 0.004, **** represents p < 0.001, N.S. represents no significance.
|