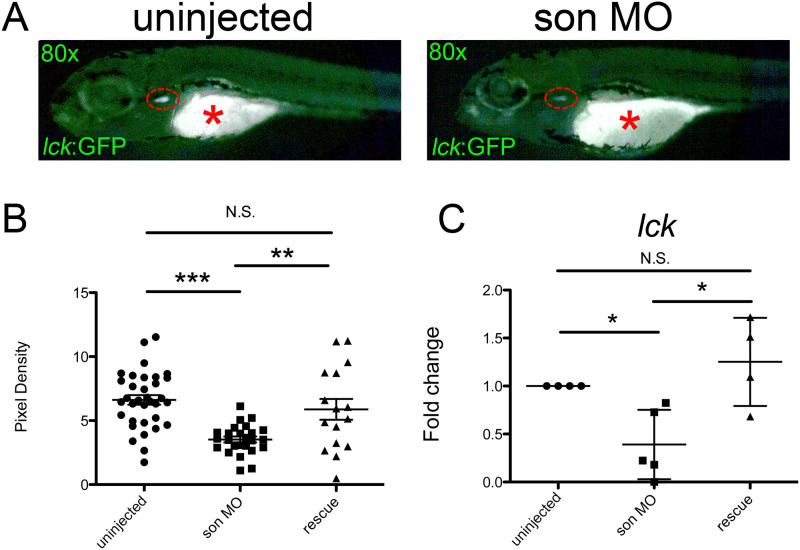
IMAGE

Fig 4

ID
ZDB-IMAGE-210307-42
Source
Figures for Belmonte et al., 2021
Image
Figure Caption

Fig 4 <italic>son</italic> reduction decreases T cell numbers.

(A) Representative images of lck:GFP embryos at 5dpf that were uninjected (control; left) or injected with MO at the one-cell-stage of development (son MO, right). Images were taken at 80x. Individual GFP+ T cells are located in the thymi (red dashed oval); these cells are not circulating. * denotes background fluorescence present in the yolk ball due to refraction of light from lipids present in the yolk. (B) Images (like shown in A) were subjected to analysis with ImageJ to determine the pixel density of uninjected, MO-injected (son MO), or MO-injected with son RNA (rescue) thymi. (C) qRT-PCR for lck was performed. Each point represents ten embryos randomly selected from uninjected, MO-injected (son MO), or MO-injected with son RNA (rescue) conditions that were analyzed by qRT-PCR. Middle lines represent mean and error bars represent SD. * represents p = 0.02, ** represents p = 0.01, *** represents p < 0.001, N.S. represents no significance.

Acknowledgments
This image is the copyrighted work of the attributed author or publisher, and ZFIN has permission only to display this image to its users. Additional permissions should be obtained from the applicable author or publisher of the image. Full text @ PLoS One