
- Title
-
HOX paralogs selectively convert binding of ubiquitous transcription factors into tissue-specific patterns of enhancer activation
- Authors
- Bridoux, L., Zarrineh, P., Mallen, J., Phuycharoen, M., Latorre, V., Ladam, F., Losa, M., Baker, S.M., Sagerstrom, C., Mace, K.A., Rattray, M., Bobola, N.
- Source
- Full text @ PLoS Genet.
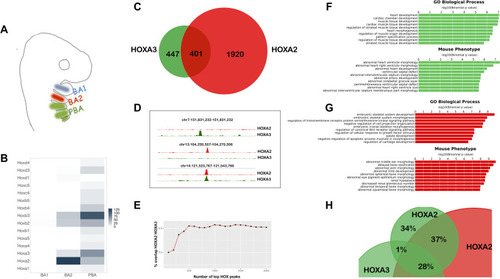
A. BA organization in mammals. BA3-6 are collectively indicated as PBA. The same colour code (BA2 red, PBA green) is used throughout the manuscript. B. Heatmap of |

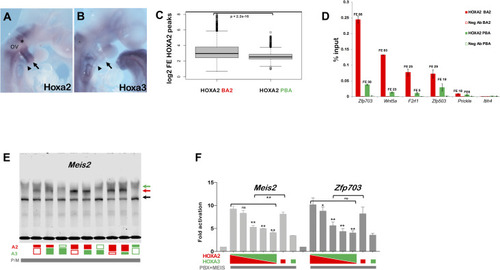
A. Homer detects different variants of the HOX-PBX motif in top 250 HOXA2 and HOXA3 peaks, with a G/C (HOXA3) or mainly a G (HOXA2) in the second variable position. B. Occurrence of HOX-PBX motif variants (all permutations of the variable nucleotides in TGATNNAT) in top 250 HOXA2 and HOXA3 peaks (ordered into 50 region bins by decreasing FE). The TGATTCAT motif (red arrows) is among the most enriched variants in HOXA3 peaks but does not virtually occur in HOXA2 peaks. C. Distribution of differential H3K27 acetylation (PBA/BA2 ratio) at top 250 HOXA3 peaks containing the four most frequent TGATNNAT variants. Data is ordered based on fold change of acetylation (fold change of normalized read counts) and divided into quartiles. The central quartiles (50% of the data) are shown in the box, while top and bottom whiskers represent the top 25% and bottom 25% (the top and the bottom quartiles) of the data, respectively. HOXA3 peaks containing the TGATTCAT variant are associated with increased enhancer activity in PBA (red line). D. UCSC tracks with HOXA3, HOXA2, PBX and MEIS binding profiles in BA2 (red) and PBA (green) at the |

A. UCSC tracks of HOXA2, HOXA3, PBX, MEIS binding and H3K27 acetylation profiles in BA2 (red) and PBA (green) at the |
AB. |

A. Overlap of HOXA3 with MEIS and PBX peaks in the same tissue (PBA) and at the same embryonic stage (E11.5) (200nt summit regions, overlap at least 1nt). The proportional Venn diagram is cropped to focus on HOXA3 peaks. B. Barplots of fold change in MEIS binding levels in PBA versus BA1. Regions co-occupied by MEIS with HOXA3 in PBA generally display higher MEIS binding levels in PBA (HOX-positive) relative to the HOX-negative BA1. In contrast, MEIS binding not overlapping HOXA3 can be higher in BA1 or in PBA. Fold changes in MEIS peaks were calculated using EdgeR (see also |

A. Proportional Venn diagram shows highly overlapping binding of MEIS in BA1, BA2 and PBA. MEIS peaks were combined and re-centered using DiffBind; out of 215830 MEIS peaks, 101055 are in common between the three tissues. B. Top MEIS peaks are different in BA2 and PBA. At high FE, there is a lower overlap between MEIS binding in BA2 and PBA. The ratio of MEIS peaks, which are common to BA2 and PBA, increases as FE decreases. C. UCSC tracks illustrate the different MEIS binding levels in BA1-BA2-PBA at the |
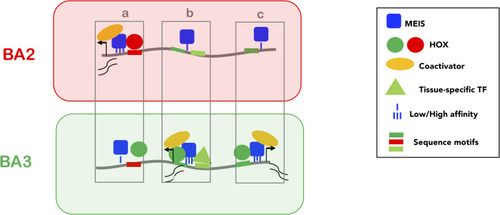
Low affinity, widespread binding of MEIS (blue square) defines a large subset of accessible chromatin (grey line) for activation (PBX is not shown as PBX and MEIS binding almost entirely overlap). Direct cooperativity with HOX (A2 and A3, red and green circles respectively) and/or indirect cooperativity with tissue-specific TFs (triangle) increase MEIS binding affinity and residence time; prolonged residence time of MEIS at enhancers promotes recruitment of general co-activators (yellow) and activation of transcription. HOX paralogs preferentially bind different subsets of MEIS occupied regions, resulting in differential transcription. Three examples of BA-specific transcription are shown. In |