IMAGE

Fig 3

ID
ZDB-IMAGE-210124-2
Source
Figures for Bridoux et al., 2020
Image
Figure Caption

Fig 3 HOXA2 control of target enhancers.

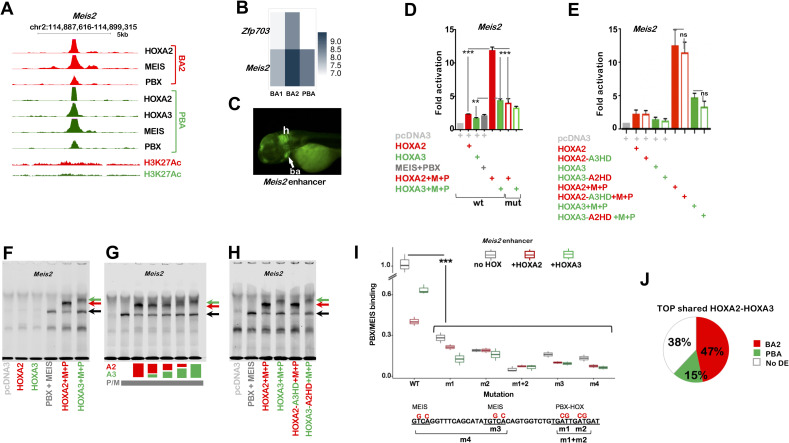
A. UCSC tracks of HOXA2, HOXA3, PBX, MEIS binding and H3K27 acetylation profiles in BA2 (red) and PBA (green) at the Meis2 locus. Strong HOX and TALE binding is observed in both tissues, with higher acetylation levels in BA2. B. Heatmap shows Meis2 and Zfp703 expression in E11.5 mouse BA1, BA2 and PBA, based on the normalized expression values CPM [30]. C. Meis2 enhancer is active in the hindbrain (h) and the BAs (ba, arrow) of developing zebrafish (72 hours post fertilization), which correspond to Meis2 expression domains in mouse [18]. The enhancer sequence spans the 200nt summit of HOXA2 peak in A. D. Luciferase activity driven by Meis2 enhancer co-transfected with Hoxa2 (red bar) or Hoxa3 (green bar) in combination with Meis2 and Pbx1a expression vectors in NIH3T3 cells. The combination of Hoxa2 with Meis2 and Pbx1a results in the highest activation. Changing the HOX-PBX site (empty bars, mutant sequence in F) reduces HOX-TALE activation. E. Luciferase activity driven by Meis2 enhancer co-transfected with Hoxa2-a3HD (red empty bar) or Hoxa3-a2HD (green empty bar) and Meis2 and Pbx1a. Values shown in DE represent fold activation over basal enhancer activity and are presented as the average of at least two independent experiments, each performed in triplicate. Error bars represent the standard error of the mean (SEM). One-way ANOVA with post-hoc Tukey HSD (Honestly Significant Difference) test: ** = p<0.005; *** = p<0.0005. F-G. Incubation of the Meis2 probe with TNT reticulocyte expressing HOXA2, HOXA3, MEIS/PBX, HOXA2/MEIS/PBX or HOXA3/MEIS/PBX as indicated. F. MEIS and PBX bind the Meis2 probe together (black arrow, see also S3E and S3F Fig). Addition of HOXA2 and HOXA3 results in a trimeric protein complex (red and green arrows respectively). Co-translation of HOXA2 with PBX/MEIS gives rise to a stronger trimeric complex relative to HOXA3 and, accordingly, to a decrease in PBX-MEIS binding as a dimer (black arrow; see also S3G Fig for quantification). G. HOX binding to Meis2 probe, alone and in combination. The total HOX dose is unvaried and corresponds to 100%; HOXA2 and HOXA3 are translated alone and co-translated with each other at different ratios, as follows: 100% HOXA2; 75% HOXA2 + 25% HOXA3; 50% HOXA2 + 50% HOXA3; 25% HOXA2 + 75% HOXA3; 100% HOXA3. Colour coded % are indicated below the gel; HOXA2 is red and HOXA3 is green. HOXA2 forms a stronger trimeric complex (red arrow) than HOXA3 (green arrow) at comparable concentrations. PBX/MEIS dimeric complex, black arrow (see also S3H and S3I Fig for quantification). H. Swapping HOXA3-HD with HOXA2-HD does not improve the ability of HOXA3 to form a ternary complex with PBX and MEIS (green arrows), and does not decrease HOXA2 binding with MEIS and PBX (red arrows). Adding HOXA2 (or HOXA2-A3HD) results in higher intensity of the trimeric complex (red arrows) and lower intensity of TALE dimeric complex relative to HOXA3 (or HOXA3-A2HD), as observed in F. I. Quantification of MEIS/PBX binding to Meis2 mutant probes. The sequence of Meis2 wild-type and mutant probes is shown below: HOX-PBX and MEIS motifs are underlined and nucleotide substitutions are shown in red. Mutants are as follows: m1 and m2 contain mutations in each half of the HOX-PBX site, m1+m2 in both halves; m3 contains mutations in MEIS site closest to HOX-PBX motif and m4 bears mutations in both MEIS sites. MEIS/PBX binding to each mutant probe is expressed as relative percentage to PBX/MEIS binding to Meis2 wild-type in the absence of HOX. Binding of PBX/MEIS dimer was quantified in the absence (black boxes) and in the presence of HOXA2 (red boxes) and HOXA3 (green boxes). Values are the result of three independent experiments; for accurate quantification, each gel was run with the reference condition (PBX/MEIS bound to Meis2 wild-type in the absence of HOX). All mutations significantly decrease PBX/MEIS binding (p<0.0005, one-way ANOVA with post-hoc Tukey HSD test). J. Top HOXA2 and HOXA3 overlapping peaks (total of 60/250 intersecting HOXA2 and HOXA3 top peaks) are more frequently associated with genes with higher expression in BA2 (red) relative to PBA (green). The white portion of the pie chart refers to genes that are not differentially expressed between BA2 and PBA (no DE). Gene association is based on GREAT standard association rules; expression levels are extracted from E11.5 RNA-seq [30].

Acknowledgments
This image is the copyrighted work of the attributed author or publisher, and ZFIN has permission only to display this image to its users. Additional permissions should be obtained from the applicable author or publisher of the image. Full text @ PLoS Genet.